

Epigenetic properties of white-opaque switching in Candida albicans are based on a self-sustaining transcriptional feedback loop
- PMID: 16899543
- PMCID: PMC1535343
- DOI: 10.1073/pnas.0605138103
Epigenetic properties of white-opaque switching in Candida albicans are based on a self-sustaining transcriptional feedback loop
Abstract
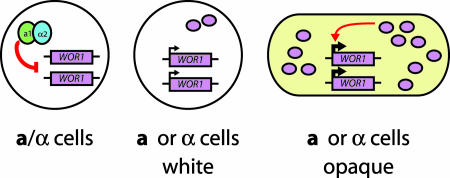
White-opaque switching in the human fungal pathogen Candida albicans is an alternation between two distinct types of cells, white and opaque. White and opaque cells differ in their appearance under the microscope, the genes they express, their mating behaviors, and the host tissues for which they are best suited. Each state is heritable for many generations, and switching between states occurs stochastically, at low frequency. In this article, we identify a master regulator of white-opaque switching (Wor1), and we show that this protein is a transcriptional regulator that is needed to both establish and maintain the opaque state. We show that in opaque cells, Wor1 forms a positive feedback loop: It binds its own DNA regulatory region and activates its own transcription leading to the accumulation of high levels of Wor1. We further show that this feedback loop is self-sustaining: Once activated, it persists for many generations. We propose that this Wor1 feedback loop accounts, at least in part, for the heritability of the opaque state. In contrast, white cells (and their descendents) lack appreciable levels of Wor1, and the feedback loop remains inactive. Thus, this simple model can account for both the heritability of the white and opaque states and the stochastic nature of the switching between them.
Conflict of interest statement
Conflict of interest statement: No conflicts declared.
Figures


Comment in
-
Single gene control of a complex phenotype hangs in the balance.Proc Natl Acad Sci U S A. 2006 Aug 22;103(34):12659-60. doi: 10.1073/pnas.0605675103. Epub 2006 Aug 14. Proc Natl Acad Sci U S A. 2006. PMID: 16908836 Free PMC article. No abstract available.
Similar articles
-
Interlocking transcriptional feedback loops control white-opaque switching in Candida albicans.PLoS Biol. 2007 Oct;5(10):e256. doi: 10.1371/journal.pbio.0050256. PLoS Biol. 2007. PMID: 17880264 Free PMC article.
-
Bistable expression of WOR1, a master regulator of white-opaque switching in Candida albicans.Proc Natl Acad Sci U S A. 2006 Aug 22;103(34):12813-8. doi: 10.1073/pnas.0605270103. Epub 2006 Aug 11. Proc Natl Acad Sci U S A. 2006. PMID: 16905649 Free PMC article.
-
The WOR1 5' untranslated region regulates white-opaque switching in Candida albicans by reducing translational efficiency.Mol Microbiol. 2015 Jul;97(1):125-38. doi: 10.1111/mmi.13014. Epub 2015 Apr 24. Mol Microbiol. 2015. PMID: 25831958 Free PMC article.
-
Regulation of white-opaque switching in Candida albicans.Med Microbiol Immunol. 2010 Aug;199(3):165-72. doi: 10.1007/s00430-010-0147-0. Med Microbiol Immunol. 2010. PMID: 20390300 Review.
-
White-opaque switching in Candida albicans.Curr Opin Microbiol. 2009 Dec;12(6):650-4. doi: 10.1016/j.mib.2009.09.010. Epub 2009 Oct 23. Curr Opin Microbiol. 2009. PMID: 19853498 Free PMC article. Review.
Cited by
-
Milbemycins: more than efflux inhibitors for fungal pathogens.Antimicrob Agents Chemother. 2013 Feb;57(2):873-86. doi: 10.1128/AAC.02040-12. Epub 2012 Dec 3. Antimicrob Agents Chemother. 2013. PMID: 23208712 Free PMC article.
-
Rapid redistribution of phosphatidylinositol-(4,5)-bisphosphate and septins during the Candida albicans response to caspofungin.Antimicrob Agents Chemother. 2012 Sep;56(9):4614-24. doi: 10.1128/AAC.00112-12. Epub 2012 Jun 11. Antimicrob Agents Chemother. 2012. PMID: 22687514 Free PMC article.
-
Control of Candida albicans morphology and pathogenicity by post-transcriptional mechanisms.Cell Mol Life Sci. 2016 Nov;73(22):4265-4278. doi: 10.1007/s00018-016-2294-y. Epub 2016 Jun 16. Cell Mol Life Sci. 2016. PMID: 27312239 Free PMC article. Review.
-
Aneuploid chromosomes are highly unstable during DNA transformation of Candida albicans.Eukaryot Cell. 2009 Oct;8(10):1554-66. doi: 10.1128/EC.00209-09. Epub 2009 Aug 21. Eukaryot Cell. 2009. PMID: 19700634 Free PMC article.
-
Farnesol and phosphorylation of the transcriptional regulator Efg1 affect Candida albicans white-opaque switching rates.PLoS One. 2023 Jan 20;18(1):e0280233. doi: 10.1371/journal.pone.0280233. eCollection 2023. PLoS One. 2023. PMID: 36662710 Free PMC article.
References
Publication types
MeSH terms
Substances
Grants and funding
LinkOut - more resources
Full Text Sources
Molecular Biology Databases
