. 2007 Jan;292(1):C319-31.
doi: 10.1152/ajpcell.00121.2006. Epub 2006 Aug 9.

Cellular mechanisms underlying prostaglandin-induced transient cAMP signals near the plasma membrane of HEK-293 cells

Affiliations
Free PMC article

Cellular mechanisms underlying prostaglandin-induced transient cAMP signals near the plasma membrane of HEK-293 cells

Thomas C Rich et al. Am J Physiol Cell Physiol. 2007 Jan.
Free PMC article

Abstract

We have previously used cyclic nucleotide-gated (CNG) channels as sensors to measure cAMP signals in human embryonic kidney (HEK)-293 cells. We found that prostaglandin E(1) (PGE(1)) triggered transient increases in cAMP concentration near the plasma membrane, whereas total cAMP levels rose to a steady plateau over the same time course. In addition, we presented evidence that the decline in the near-membrane cAMP levels was due primarily to a PGE(1)-induced stimulation of phosphodiesterase (PDE) activity, and that the differences between near-membrane and total cAMP levels were largely due to diffusional barriers and differential PDE activity. Here, we examine the mechanisms regulating transient, near-membrane cAMP signals. We observed that 5-min stimulation of HEK-293 cells with prostaglandins triggered a two- to threefold increase in PDE4 activity. Extracellular application of H89 (a PKA inhibitor) inhibited stimulation of PDE4 activity. Similarly, when we used CNG channels to monitor cAMP signals we found that both extracellular and intracellular (via the whole-cell patch pipette) application of H89, or the highly selective PKA inhibitor, PKI, prevented the decline in prostaglandin-induced responses. Following pretreatment with rolipram (a PDE4 inhibitor), H89 had little or no effect on near-membrane or total cAMP levels. Furthermore, disrupting the subcellular localization of PKA with the A-kinase anchoring protein (AKAP) disruptor Ht31 prevented the decline in the transient response. Based on these data we developed a plausible kinetic model that describes prostaglandin-induced cAMP signals. This model has allowed us to quantitatively demonstrate the importance of PKA-mediated stimulation of PDE4 activity in shaping near-membrane cAMP signals.


Figures

Fig. 1
Fig. 1
PKA-dependent regulation of phosphodiesterase (PDE)4 by PGE2 in human embryonic kidney (HEK)-293 cells. A and B: time course of PDE4 activation in the soluble (A) and particulate (B) fractions of HEK-293 cell extracts. Cells were incubated for the times indicated in the abscissa with 1 μM PGE2. At the end of the incubation, cells were harvested and homogenates fractionated by centrifugation as detailed in Materials and Methods. Aliquots of the supernatant or the resuspended pellet were used to measure PDE activity using 1 μM cAMP as substrate in the absence or presence of 10 μM rolipram (a PDE4 inhibitor). The rolipram-inhibited PDE activity (PDE4 activity) is reported. Data are the means ± SE of three separate experiments each carried out in triplicate. C: H89 (a PKA inhibitor) inhibition of the PGE2-stimulated PDE4 activity in HEK-293 cells. Cells were preincubated in the absence or presence of the increasing concentrations of H89 reported in the abscissa. After 10 min, cells were stimulated with 1 μM PGE2 for an additional 5 min. At the end of the incubation, the PDE activity in the homogenate was measured as detailed in MATERIALS AND METHODS. PGE2 at 1 μM significantly increased PDE4 activity (P ≤ 0.05). The stimulation of PDE4 activity was inhibited by pretreatment with 10 μM H89 (P ≤ 0.05). Significance was evaluated using Student’s t-test. D: cells were stimulated with PGE2 as described in (C). Incubation was terminated by the addition of sample buffer, and protein in the cell extract was fractionated by SDS-PAGE and transferred to nylon membranes. After blocking, blots were probed with phospho-specific cAMP response element binding protein (CREB) antibodies. After the first exposure, blots were stripped and reprobed with a CREB antibody. Data are reported as the ratio between the phospho-CREB and the CREB signals quantified by image analysis. A representative experiment of the three performed is reported.
Fig. 2
Fig. 2
PKA activity does not significantly inhibit endogenous prostanoid receptor or adenylyl cyclase (AC) activity in HEK-293 cells. Cyclic AMP accumulation was measured with enzyme immunoassays. HEK-293 cells (0.9 × 10⁶/well) were stimulated for 5 min with 1 μM forskolin, 1 μM PGE1, or 1 μM PGE2 (as indicated) following pretreatment with vehicle (solid bars), 10 μM H89 (10 min, open bars), 10 μM rolipram (5 min, cross-hatched bars), or 10 μM H89 + 10 μM rolipram (hatched bars). H89 had little or no effect on prostaglandin-induced cAMP accumulation (5 min) in the presence of rolipram. Pretreatment with H89, rolipram, or H89 + rolipram causes significant increases in agonist-induced cAMP accumulation. Significance was evaluated using Student’s t-test, *P < 0.05. Similar results were obtained with 10 μM H89 and 100 μM IBMX (data not shown). These data indicate that H89 has little effect on the endogenous AC activity in HEK-293 cells. Data represent the means ± SE of three experiments conducted in triplicate.
Fig. 3
Fig. 3
Rolipram and H89 (PDE4 and PKA inhibitors) inhibit the decline in prostaglandin-induced transient cAMP signals. Near-membrane cAMP levels were monitored by measuring Ca2+ influx through C460W/E583M cyclic nucleotidegated (CNG) channels in response to 0.1 or 1 μM PGE1 applied at 60 s (arrows). Addition of PGE1 triggered a transient increase in intracellular Ca2+ (A). Three-minute pretreatment with 10 μM rolipram prevented the decline in the transient response induced by PGE1 (B). Similarly, 10-min pre-treatment with 10 μM H89 inhibited the decline in the transient response (C). Pretreatment with both 10 μM H89 (10 min) and 10 μM rolipram (3 min) prevented the decline in the transient response (D). Similar results were obtained using PGE2 (data not shown). Data are representative of at least 4 experiments.
Fig. 4
Fig. 4
Single-cell measurement of PGE1-induced cAMP signals. A: outward currents through CNG channels revealed a transient increase in cAMP level in response to bath application of 1 μM PGE1. Currents were measured in the whole-cell, patch-clamp configuration during 400-ms steps to a test potential of +20 mV, from a holding potential of 0 mV. Dotted lines indicate zero current. B: single cell response in which the cell was pretreated for 5 min with 10 μM rolipram before exposure to 1 μM PGE1. C: single cell response in which the cell was initially exposed to 1 μM PGE1 prior to exposure to 10 μM rolipram + 1 μM PGE1 (at indicated times). These data clearly indicate that PGE1-induced cAMP accumulation did not saturate the CNG channels. D: data similar to those shown in A and B were quantified by measuring the percentage of current remaining 3 min after the peak current. Following pretreatment with rolipram, the decline in the PGE1-induced current was significantly reduced. Data are given as means ± SE. Significance was evaluated using Student’s t-test (***P ≤ 0.01). No PGE1-induced currents were observed in cells not expressing CNG channels (n = 7).
Fig. 5
Fig. 5
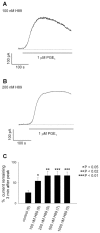
Low intracellular concentrations of H89 inhibit the decay of cAMP signals measured in single HEK-293 cells. A and B: the response of cells to 1 μM PGE1 with 100 or 200 nM H89 included in the whole-cell, patch pipette solution. The pipette solution was allowed to equilibrate with the cell for at least 10 min after achieving whole-cell configuration. The decay of the transient response was significantly reduced in an H89 dose-dependent manner. Application of 10 mM MgCl2 blocked the PGE1-induced currents. The dotted lines indicate zero current. C: to quantify the results we measured the percentage of current remaining 3 min after the peak current. The H89 dose-dependence is consistent with H89 inhibition of PKA activity, and thus supports the hypothesis that PKA-mediated phosphorylation of PDE4 stimulates PDE activity, which is the primary factor in the decay of the transient PGE1-induced cAMP signal. The number of experiments is indicated in parentheses. Data are given as means ± SE. Significance was evaluated using Student’s t-test (*P ≤ 0.05, **P ≤ 0.02, ***P ≤ 0.01).
Fig. 6
Fig. 6
PKI, a highly selective PKA inhibitor, inhibits the decay of cAMP signals measured in single HEK-293 cells. A and B: 1 μM PGE1 triggered outward current through CNG channels in whole-cell configuration (monitored during steps to +20 mV). Both 5 nM (A) and 20 nM (B) PKI significantly inhibited the decay of the transient cAMP response. Currents were subsequently blocked by 10 mM MgCl2. Dotted lines indicate zero current. C: to quantify the results we measured the percentage of current remaining 3 min after the peak current. Inhibition of the decay in the transient response by 5 and 20 nM PKI provide strong evidence that PKA-mediated phosphorylation of PDE4 is responsible for the observed increase in PDE activity. Data are given as means ± SE. The number of experiments is indicated in parentheses. Significance was evaluated using Student’s t-test (***P < 0.01).
Fig. 7
Fig. 7
The AKAP inhibitor peptide Ht31 inhibits the decline in PGE1-induced cAMP signals. A and B: 10 μM stearated (St)-Ht31, but not the control peptide, significantly inhibited the decay in PGE1-induced transient cAMP responses monitored using the whole-cell, patch-clamp configuration. C: to quantify the results we measured the percentage of current remaining 3 min after the peak current. Inhibition of the decay in the transient response by 10 μM Ht31 provides strong evidence that AKAP-mediated subcellular localization of PKA is critical for PKA-mediated stimulation of PDE4 activity. Data are given as means ± SE. The number of experiments is indicated in parentheses. Significance was evaluated using Student’s t-test (***P ≤ 0.01).
Fig. 8
Fig. 8
Schematic of the feedback mechanism that increases PDE4 activity. Ligand binding to the prostaglandin (EP) receptor leads to activation of stimulatory G protein (Gs), activation of AC, and stimulation of cAMP synthesis. Binding of cAMP to the regulatory subunit of PKA releases the catalytic subunit and buffers free cAMP levels. PKA-mediated phosphorylation of PDE4 triggers a 2- to 3-fold increase in the Vmax. The increase in PDE4 activity is primarily responsible for the reduction in free cAMP levels.
Fig. 9
Fig. 9
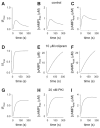
Simulations of cAMP signals near the plasma membrane of HEK-293 cells. Equations for the simulations are described in the text, and parameters are given in Table 1. AC depict CNG channel current (A), free cAMP concentrations (B), and the total cAMP levels (C) elicited in response to a step activation of AC (similar to what would be expected from rapid exposure to saturating concentrations of PGE1 or PGE2). The total cAMP levels represent free and bound cAMP near the plasma membrane (not total cellular cAMP levels). The overall time course and current remaining 3 min after the peak are similar to the experimental data presented in Figs. 3 and 4. DF depict CNG channel current and cAMP levels elicited in the presence of 10 μM rolipram, a competitive PDE4 inhibitor. Free cAMP levels quickly rise to levels that saturate CNG channels (D and E), consistent with the data presented in Fig. 3. GI depict the response in the presence of 20 nM PKI, a noncompetitive PKA inhibitor (KI-PKI = 2.3 nM). Note that the basal PDE4 activity is sufficient to prevent cAMP from reaching levels that would saturate CNG channels.
Fig. 10
Fig. 10
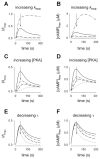
Effects of altering model parameters on CNG channel activity and underlying cAMP signals. In all panels the solid traces represent simulations with the parameters listed in Table 1. A and B depict the response to altered PDE4 activity (kPDE). kPDE values were 0.055 s−1 (broken line), 0.11 s−1 (solid line), 0.22 s−1 (dashed line), and 0.44 s−1 (dotted line), and kPDEp values remained 3 · kPDE. C and D depict the responses with PKA concentrations of 1 μM (solid line), 2 μM (broken line), 5 μM (dashed line) and 10 μM (dotted line). Note the significant lag in the activation of CNG channels in the presence of higher PKA concentrations. E and F depict the effects of decreasing τ, or increasing the rate at which cAMP production is reduced. In these simulations τ = 2,000 s (solid line), 1,000 s (broken line), 500 s (dashed line), or 200 s (dotted line).

Similar articles

Cited by

References

    1. Barnes AP, Livera G, Huang P, Sun C, O’Neal WK, Conti M, Stutts MJ, Milgram SL. Phosphodiesterase 4D forms a cAMP diffusion barrier at the apical membrane of the airway epithelium. J Biol Chem. 2005;280:7997–8003. - PubMed
    1. Beavo JA, Bechtel PJ, Krebs EG. Activation of protein kinase by physiological concentrations of cyclic AMP. Proc Natl Acad Sci USA. 1974;71:3580–3583. - PMC - PubMed
    1. Bolger GB, Erdogan S, Jones RE, Loughney K, Scotland G, Hoffmann R, Wilkinson I, Farrell C, Houslay MD. Characterization of five different proteins produced by alternatively spliced mRNAs from the human cAMP-specific phosphodiesterase PDE4D gene. Biochem J. 1997;328:539–548. - PMC - PubMed
    1. Brunton LL, Hayes JS, Mayer SE. Functional compartmentation of cAMP and protein kinase in heart. Adv Cyclic Nucleotide Res. 1981;14:391–397. - PubMed
    1. Carr DW, Stofko-Hahn RE, Fraser ID, Bishop SM, Acott TS, Brennan RG, Scott JD. Interaction of the regulatory subunit (RII) of cAMP-dependent protein kinase with RII-anchoring proteins occurs through an amphipathic helix binding motif. J Biol Chem. 1991;266:14188–14192. - PubMed

Publication types

MeSH terms

LinkOut - more resources