. 2006 Aug 1;12(15):4662-70.
doi: 10.1158/1078-0432.CCR-06-0459.

Effect of altering dietary omega-6/omega-3 fatty acid ratios on prostate cancer membrane composition, cyclooxygenase-2, and prostaglandin E2

Affiliations

Effect of altering dietary omega-6/omega-3 fatty acid ratios on prostate cancer membrane composition, cyclooxygenase-2, and prostaglandin E2

Naoko Kobayashi et al. Clin Cancer Res. .

Abstract

Purpose: To determine whether altering the dietary content of omega-6 (n-6) and omega-3 (n-3) polyunsaturated fatty acids affects the growth of androgen-sensitive prostate cancer xenografts, tumor membrane fatty acid composition, and tumor cyclooxygenase-2 and prostaglandin E(2) (PGE(2)) levels.

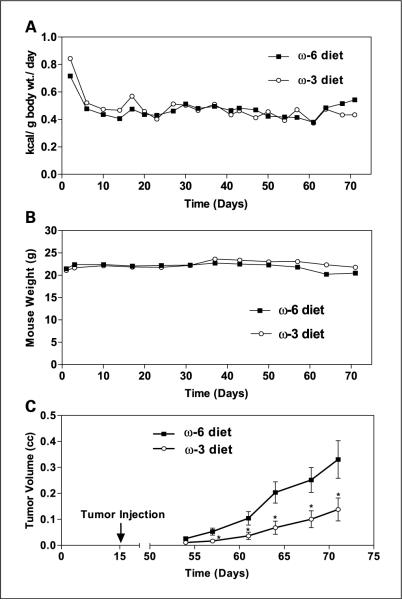
Experimental design: Individually caged male severe combined immunodeficiency mice were fed isocaloric 20% kcal fat diets with the fat derived either primarily from n-6 fatty acids (n-6 group) or with the fat consisting of n-6 and n-3 fatty acids in a ratio of 1:1 (n-3 group), and injected s.c. with Los Angeles Prostate Cancer 4 (LAPC-4) cells. Tumor volumes and mouse weights were measured weekly, caloric intake was measured 3 days per week, and tumors and serum were harvested at 8 weeks postinjection.

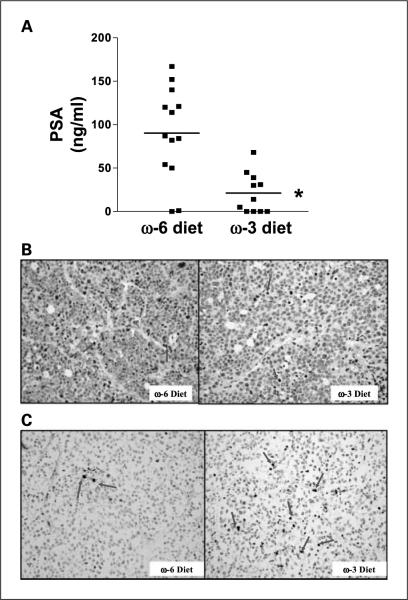
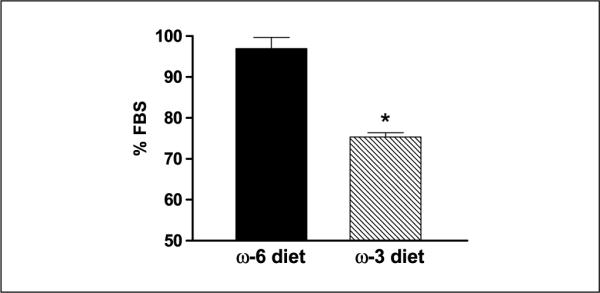
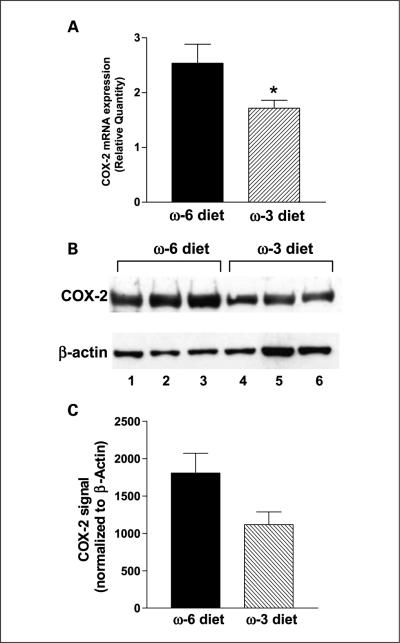
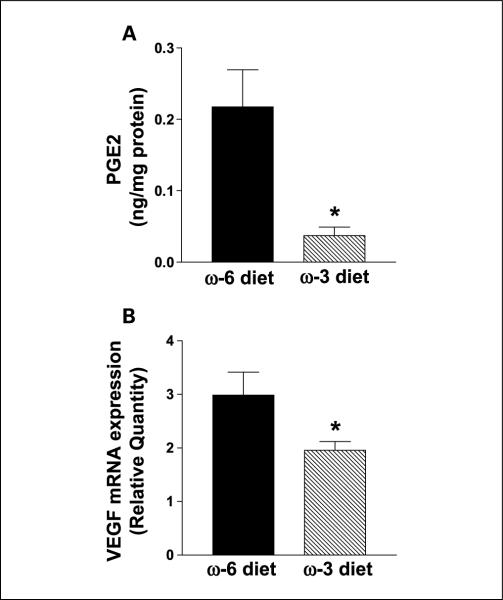
Results: Tumor growth rates, final tumor volumes, and serum prostate-specific antigen levels were reduced in the n-3 group relative to the n-6 group. The n-3 group tumors had decreased proliferation (Ki67 staining) and increased apoptosis (terminal nucleotidyl transferase-mediated nick end labeling staining). In vitro proliferation of LAPC-4 cells in medium containing n-3 group serum was reduced by 22% relative to LAPC-4 cells cultured in medium containing serum from the n-6 group. The n-6/n-3 fatty acid ratios in serum and tumor membranes were lower in the n-3 group relative to the n-6 group. In addition, n-3 group tumors had decreased cyclooxygenase-2 protein and mRNA levels, an 83% reduction in PGE(2) levels, and decreased vascular endothelial growth factor expression.

Conclusion: These results provide a sound basis for clinical trials evaluating the effect of dietary n-3 fatty acids from fish oil on tumor PGE(2) and membrane fatty acid composition, and serum and tumor biomarkers of progression in men with prostate cancer.


Figures

Fig. 1
Fig. 1
Severe combined immunodeficiency mouse energy intake, weight, and LAPC-4 xenograft growth. Eight-week-old male severe combined immunodeficiency mice were fed either n-6 diet or n-3 diet (n = 15 per group) for 2 weeks prior to injection of 1×10⁵ LAPC-4 in the lateral flank. A, caloric intake was measured for each mouse thrice per week by subtracting the weight of uneaten food from the weight of the food given at the beginning of each feeding period. B, mice were weighed weekly. C, tumor volumes were measured weekly. Points, means; bars, ±SE; two-tailed Student's t test (*, P < 0.05).
Fig. 2
Fig. 2
Effects of n-3 diet on serum PSA, tumor cell proliferation, and apoptosis. A, decreased serum PSA in the n-3 diet group. Human PSA levels in mouse serum collected at the time of euthanasia was measured by ELISA. n = 13 for n-6 diet group; n = 11 for n-3 diet group. Horizontal line, mean value of each group (*, P < 0.001). B, decreased cell proliferation in LAPC-4 xenografts from the n-3 diet group. Ki67-positive cells (arrows, proliferative index) decreased by 65% in the n-3 diet group compared with the n-6 group. A total of 100 cells were counted for each sample; n = 13 for n-6 diet; n = 14 for n-3 diet (*, P < 0.001). C, apoptosis was examined by terminal nucleotidyl transferase – mediated nick end labeling assay. The percentage of apoptotic cells (arrows) increased in the n-3 diet group by 67%. A total of 200 cells per sample were counted (n = 12 for n-6 diet group; n = 13 for n-3 diet; P = 0.05).
Fig. 3
Fig. 3
Ex vivo LAPC-4 proliferation in mouse serum. LAPC-4 cells were plated at 5 × 10³ cells/well in 96-well plates for 24 hours, then incubated for 48 hours with the fresh medium containing 10% mouse serum from individual mice (serum was not pooled) from the n-6 or n-3 diet group. Cell proliferation was determined by measuring formazan product formation by dehydrogenase activity of viable cells. The doubling time of LAPC-4 cells in medium containing 10% fetal bovine serum was ~48 hours under these experimental conditions. All experiments were done in duplicate. Data is expressed as a percentage of LAPC-4 growth in medium containing 10% fetal bovine serum. Columns, means; bars, ±SE; n = 12 for n-6 diet; n = 15 for n-3 diet (*, P < 0.05). In a separate set of experiments, there was no difference in apoptosis using an ELISA assay (Cell Death Detection ELISA Plus, Roche Applied Science, Indianapolis, IN) of LAPC-4 cells incubated for 48 hours in medium containing nonpooled n-6 and n-3 mouse serum (data not shown).
Fig. 4
Fig. 4
Effects of n-3 and n-6 diets on COX-2 mRNA and protein levels in LAPC-4 tumors. A, COX-2 mRNA expression was determined using real-time reverse transcriptase-PCR relative to GAPDH mRNA, a reference housekeeping gene. n = 8 for n-6 diet group and n = 10 for n-3 diet group (*, P < 0.05).The experiment was repeated twice. B, Western blot analysis of COX-2 protein. Lanes 1 to 3 are protein samples from three different tumors from the n-6 diet group and lanes 4 to 6 contain individual protein samples from three tumors from the n-3 diet group. The β-actin band was used for protein loading controls. C, the optimized bands were quantified by densitometry and shown as an average of each diet group for COX-2 protein levels normalized by β-actin band (values are relative densitomeric units with SE; n = 4 for each group, the experiment was repeated thrice.
Fig. 5
Fig. 5
Effects of n-3 diet on PGE2 levels and VEGF mRNA expression in LAPC-4 xenografts. A, PGE2 was extracted from tumors and quantified by high-performance liquid chromatography/diode array detection and electrospray ionization mass spectrometry analysis. PGE2 peak was clearly separated from the PGE3 peak. n = 4 for each group (*, P = 0.01). B, VEGF expression was down-regulated in the n-3 diet group. Total RNA was analyzed for VEGF mRNA relative to GAPDH mRNA using quantitative reverse transcriptase-PCR. n = 8 for n-6 diet and n = 10 for n-3 diet. The experiment was repeated thrice (*, P < 0.05).

Similar articles

Cited by

References

    1. Rose DP, Connolly JM. Effects of fatty acids and eicosanoid synthesis inhibitors on the growth of two human prostate cancer cell lines. Prostate. 1991;18:243–54. - PubMed
    1. Pandalai PK, Pilat MJ, Yamazaki K, Naik H, Pienta KJ. The effects of omega-3 and omega-6 fatty acids on in vitro prostate cancer growth. Anticancer Res. 1996;16:815–20. - PubMed
    1. Karmali RA, Reichel P, Cohen LA, et al. The effects of dietary omega-3 fatty acids on the DU-145 transplantable human prostatic tumor. Anticancer Res. 1987;7:1173–9. - PubMed
    1. Rose DP, Cohen LA. Effects of dietary menhaden oil and retinyl acetate on the growth of DU 145 human prostatic adenocarcinoma cells transplanted into athymic nude mice. Carcinogenesis. 1988;9:603–5. - PubMed
    1. Chung BH, Mitchell SH, Zhang JS, Young CY. Effects of docosahexaenoic acid and eicosapentaenoic acid on androgen-mediated cell growth and gene expression in LNCaP prostate cancer cells. Carcinogenesis. 2001;22:1201–6. - PubMed

Publication types

MeSH terms