Comparative Study
. 2006 Sep;16(9):1169-81.
doi: 10.1101/gr.5235706. Epub 2006 Aug 9.

Graemlin: general and robust alignment of multiple large interaction networks

Affiliations
Comparative Study

Graemlin: general and robust alignment of multiple large interaction networks

Jason Flannick et al. Genome Res. 2006 Sep.

Abstract

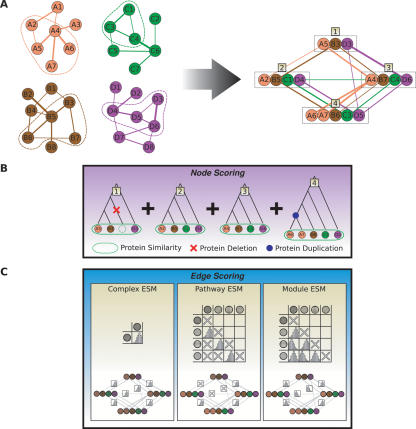
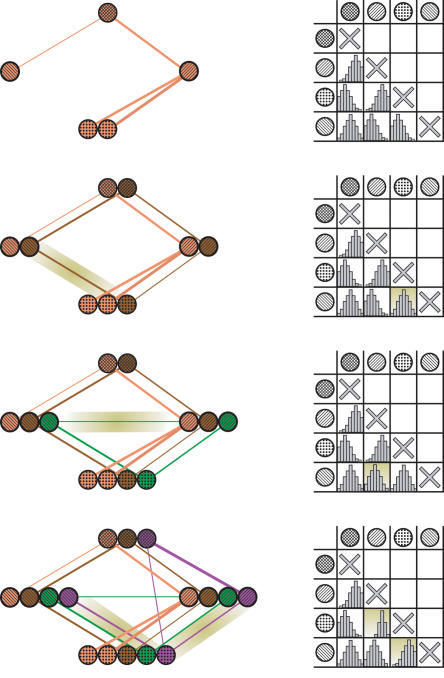
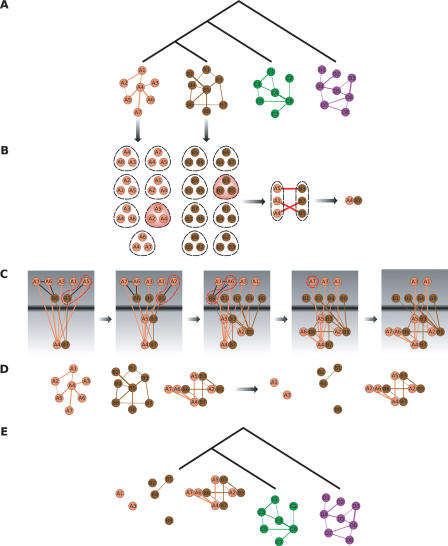
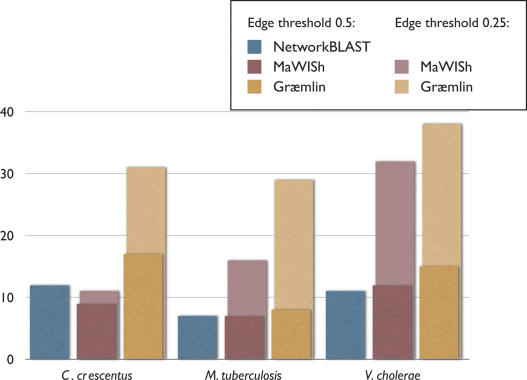
The recent proliferation of protein interaction networks has motivated research into network alignment: the cross-species comparison of conserved functional modules. Previous studies have laid the foundations for such comparisons and demonstrated their power on a select set of sparse interaction networks. Recently, however, new computational techniques have produced hundreds of predicted interaction networks with interconnection densities that push existing alignment algorithms to their limits. To find conserved functional modules in these new networks, we have developed Graemlin, the first algorithm capable of scalable multiple network alignment. Graemlin's explicit model of functional evolution allows both the generalization of existing alignment scoring schemes and the location of conserved network topologies other than protein complexes and metabolic pathways. To assess Graemlin's performance, we have developed the first quantitative benchmarks for network alignment, which allow comparisons of algorithms in terms of their ability to recapitulate the KEGG database of conserved functional modules. We find that Graemlin achieves substantial scalability gains over previous methods while improving sensitivity.


Figures

Figure 1.
Figure 1.
Method for scoring a multiple network alignment. (A) A sample multiple alignment. The four networks are from four different species. Each circle represents a protein, and edges link proteins that are hypothesized to interact; the width of an edge is proportional to the probability that an interaction is present. This sample alignment of the networks consists of four equivalence classes, numbered 1 through 4. (B) Node scoring method. Græmlin first scores each equivalence class independently by reconstructing the most parsimonious ancestral history of the involved proteins and then assessing penalties for sequence mutations and protein insertions, deletions, duplications, and divergences. Græmlin scores sequence mutations by using weighted sum-of-pairs scoring, obtaining pairwise scores based on BLAST results of the proteins; it scores all other events using heuristic constants. (C) Edge scoring method. Græmlin scores each edge using an Edge Scoring Matrix (ESM) as described in the text. For illustrative purposes, three alternative ESMs are shown, together with how Græmlin would score the alignment using each of them. The first ESM rewards protein complexes by specifying that edges between any pair of equivalence classes should have high weight; the matrix has only one cell because every edge is scored with the same distribution. The Complex ESM will score the alignment fairly highly but will penalize it because of the missing edges between equivalence classes 1 and 4 as well as 2 and 3. The Pathway ESM assigns a higher score to the alignment because it does not require high weight edges between all pairs of equivalence classes. It achieves this by a four-row matrix, where each label corresponds to a distinct node in a four-protein pathway. Edges between adjacent nodes in the pathway have high weights, and all other edges can have high or low weights without affecting the score; “don't care” distributions, symbolized by an X in the matrix, assign a score of 0 to those edges. The Module ESM assigns an even higher score to the alignment by conforming exactly to its structure; such an ESM is useful when a known module in one species is used as a query for searching another network.
Figure 2.
Figure 2.
An example of an LSSM. As Græmlin successively adds species to the multiple alignment, the distributions in the ESM cells change to reflect the new edges. At each step, the cell with a modified distribution is highlighted together with the edge that caused the change.
Figure 3.
Figure 3.
Outline of the Græmlin algorithm. (A) Shown here are four networks, together with their phylogenetic relationship. Græmlin will multiply align all four. (B) Græmlin first performs a pairwise alignment of the two closest species. It generates a set of d-clusters from each network; each node and its d − 1 closest neighbors constitute a d-cluster. Græmlin scores all pairs of d-clusters by finding for each pair the highest scoring mapping among nodes and selects the pairs that score greater than a user-specified threshold T; one particular high-scoring pair is highlighted together with the node mapping responsible for its score. Græmlin transforms all high-scoring pairs into seeds by aligning the two highest scoring nodes. (C) Græmlin extends the seed using a greedy algorithm; each extension step is shown in a gray box. At each step, Græmlin adds to the frontier all nodes connected to a node currently in the alignment; the frontier is shown in the upper half of each box. Græmlin adds to the alignment the pair of nodes or single node from the frontier that maximally increases the alignment score; the extension phase stops when no nodes from the frontier can augment the alignment score. (D) Græmlin transforms the resulting alignment, together with the unaligned nodes from the two original networks, into three generalized networks for use in the next phase of progressive alignment. (E) In the next step of progressive alignment, Græmlin will perform three pairwise alignments, one for each of the newly created generalized networks. Its running time will not scale by a factor of 3, however, as the total number of nodes in all networks remains roughly the same.
Figure 4.
Figure 4.
Sensitivity comparison of methods. For three pairwise alignments of E. coli, shown are the number of KEGGs hit by each aligner. For Græmlin and MaWISh, this graph includes results on networks with edge thresholds of both hold and 0.5. For NetworkBLAST, however, we only include results on networks thresholded at 0.5, as it did not scale to denser inputs.
Figure 5.
Figure 5.
Running-time performance of Græmlin. (A) The speed sensitivity trade-off. Each point represents a run of Græmlin with d = 4 and different values of T. For each set of parameters, the x-axis plots the running time, and the y-axis plots the fraction of alignable KEGGs hit. (B) Progressive multiple alignment. Beginning with E. coli, we added species of increasing evolutionary distance to the multiple alignment. The pairwise running time is comparatively high because the two species aligned, E. coli and S. typhimurium, are the two most similar species and have many high-scoring alignments. In this manner, adding particularly close species to the alignment can lead to higher-than-average increases in running time, but over all species the average scaling will remain roughly linear.
Figure 6.
Figure 6.
Two alignments of proteins involved in DNA replication. (A) A pairwise alignment between E. coli and C. crescentus includes several proteins involved in cell division as well as a conserved thiophene and furan oxidation protein. (B) A multiple alignment extends the pairwise alignment to include S. typhimurium, V. cholerae, C. jejuni, H. pylori, M. tuberculosis, S. pneumoniae, and Synechocystis. In this and subsequent figures, each colored box represents a protein and each vertical array of boxes represents an equivalence class; Græmlin hypothesizes that proteins in the same equivalence class performed the same function in the most recent common ancestor of the aligned species. To avoid clutter, individual proteins are not labeled, and, instead, each equivalence classis labeled with the consensus gene name of the proteins in it; as an example of the set of proteins aligned in an equivalence class, the detailed inset shows the specific proteins aligned to gyrB. Each protein is colored according to species, using the color code in Table 1; edges are also colored using the same scheme, and the width of each edge is proportional to its weight. In this figure, equivalence classes in the multiple alignment are highlighted the same color as the pairwise equivalence classes that they subsume.
Figure 7.
Figure 7.
An alignment including proteins involved in cell division. This alignment implicates several proteins in bacterial cell division; it includes all species listed in Table 1.
Figure 8.
Figure 8.
An alignment of a hypothetical functional module. In this alignment, proteins involved in biopolymer transport interact with proteins involved in DNA recombination. The sum total of these interactions in six species suggests that the proteins may be a part of a conserved functional module responsible for transformation.

Similar articles

Cited by

References

    1. Alexandersson M., Cawley S., Pachter L., Cawley S., Pachter L., Pachter L. SLAM: Cross-species gene finding and alignment with a generalized pair hidden Markov model. Genome Res. 2003;13:496–502. - PMC - PubMed
    1. Altschul S.F., Carroll R.J., Lipman D.J., Carroll R.J., Lipman D.J., Lipman D.J. Weights for data related by a tree. J. Mol. Biol. 1989;207:647–653. - PubMed
    1. Altschul S.F., Gish W., Miller W., Myers E.W., Lipman D.J., Gish W., Miller W., Myers E.W., Lipman D.J., Miller W., Myers E.W., Lipman D.J., Myers E.W., Lipman D.J., Lipman D.J. Basic local alignment search tool. J. Mol. Biol. 1990;215:403–410. - PubMed
    1. Altschul S.F., Madden T.L., Schaffer A.A., Zhang J., Zhang Z., Miller W., Lipman D.J., Madden T.L., Schaffer A.A., Zhang J., Zhang Z., Miller W., Lipman D.J., Schaffer A.A., Zhang J., Zhang Z., Miller W., Lipman D.J., Zhang J., Zhang Z., Miller W., Lipman D.J., Zhang Z., Miller W., Lipman D.J., Miller W., Lipman D.J., Lipman D.J. Gapped BLAST and PSI-BLAST: A new generation of protein database search programs. Nucleic Acids Res. 1997;25:3389–3402. - PMC - PubMed
    1. Andreeva A., Howorth D., Brenner S.E., Hubbard T.J.P., Chothia C., Murzin A.G., Howorth D., Brenner S.E., Hubbard T.J.P., Chothia C., Murzin A.G., Brenner S.E., Hubbard T.J.P., Chothia C., Murzin A.G., Hubbard T.J.P., Chothia C., Murzin A.G., Chothia C., Murzin A.G., Murzin A.G. SCOP database in 2004: Refinements integrate structure and sequence family data. Nucleic Acids Res. 2004;32:D226–D229. - PMC - PubMed

Publication types

LinkOut - more resources