Comparative Study
. 2006 Sep;16(9):1136-48.
doi: 10.1101/gr.5402306. Epub 2006 Aug 9.

High-resolution genomic profiling of chromosomal aberrations using Infinium whole-genome genotyping

Affiliations
Comparative Study

High-resolution genomic profiling of chromosomal aberrations using Infinium whole-genome genotyping

Daniel A Peiffer et al. Genome Res. 2006 Sep.

Abstract

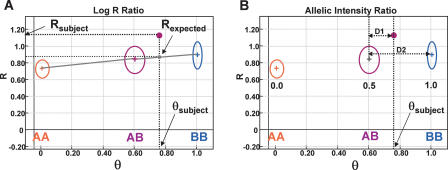
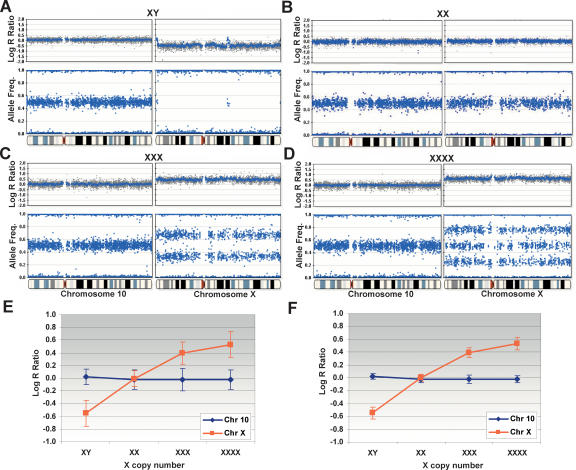
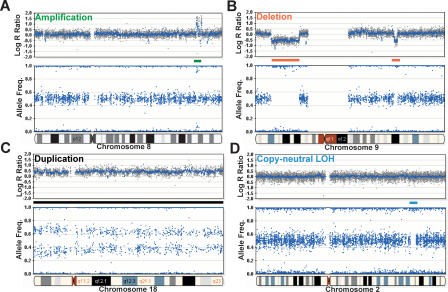
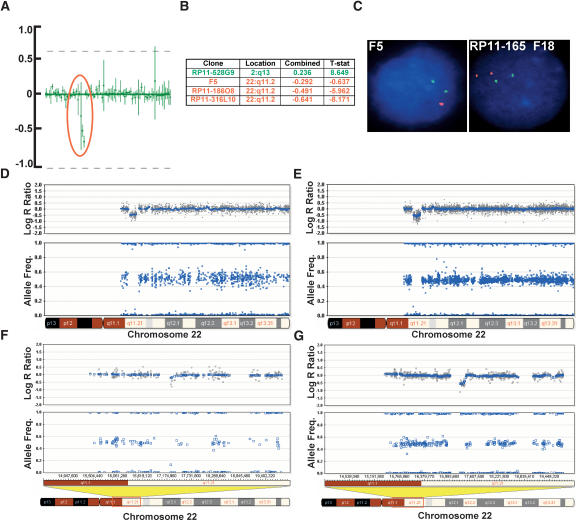
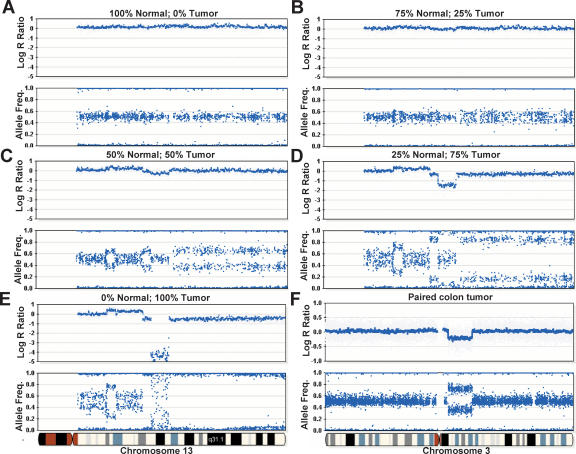
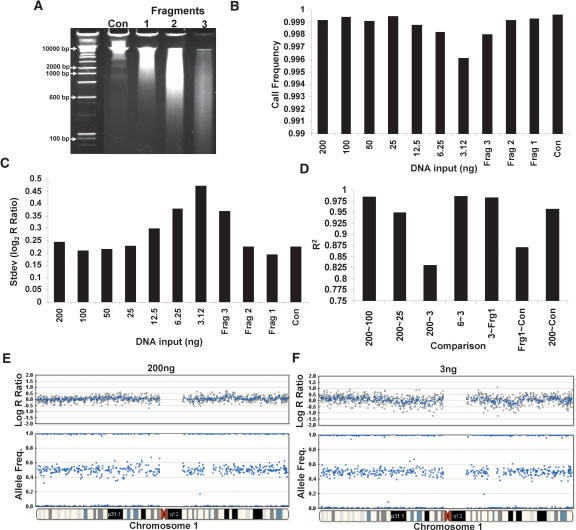
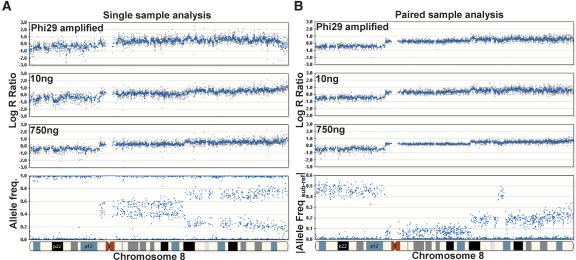
Array-CGH is a powerful tool for the detection of chromosomal aberrations. The introduction of high-density SNP genotyping technology to genomic profiling, termed SNP-CGH, represents a further advance, since simultaneous measurement of both signal intensity variations and changes in allelic composition makes it possible to detect both copy number changes and copy-neutral loss-of-heterozygosity (LOH) events. We demonstrate the utility of SNP-CGH with two Infinium whole-genome genotyping BeadChips, assaying 109,000 and 317,000 SNP loci, to detect chromosomal aberrations in samples bearing constitutional aberrations as well tumor samples at sub-100 kb effective resolution. Detected aberrations include homozygous deletions, hemizygous deletions, copy-neutral LOH, duplications, and amplifications. The statistical ability to detect common aberrations was modeled by analysis of an X chromosome titration model system, and sensitivity was modeled by titration of gDNA from a tumor cell with that of its paired normal cell line. Analysis was facilitated by using a genome browser that plots log ratios of normalized intensities and allelic ratios along the chromosomes. We developed two modes of SNP-CGH analysis, a single sample and a paired sample mode. The single sample mode computes log intensity ratios and allelic ratios by referencing to canonical genotype clusters generated from approximately 120 reference samples, whereas the paired sample mode uses a paired normal reference sample from the same individual. Finally, the two analysis modes are compared and contrasted for their utility in analyzing different types of input gDNA: low input amounts, fragmented gDNA, and Phi29 whole-genome pre-amplified DNA.


Figures

Figure 1.
Figure 1.
Analyzing SNP-CGH data. (A) The log2 R ratio compares the observed normalized intensity (Rsubject) of the subject sample to the expected intensity (Rexpected; gray dot) based on the observed allelic ratio, θsubject, through a linear interpolation (gray lines) of the canonical clusters AA, AB, and BB (shown as circles) in the GenoPlot. The normalized intensity value obtained from a single SNP is represented as a purple dot. The R and θ values for the subject are shown with thick black dotted lines. (B) The canonical clusters (shown as circles) are also used to convert θ values, that is, θsubject, to B allele frequency (allelic copy ratio). This is accomplished by a linear interpolation of the known allele frequencies assigned to each cluster (0.0, 0.5, and 1.0). The allele frequency for an observed θ value falling between two clusters is also calculated by linear interpolation with lines D1 and D2. In the example shown, a data point falling approximately a third of the distance from the AB to the BB cluster (e.g., θsubject ∼ 0.76) has an allele frequency of 0.5 + 0.33 * 0.5 = 0.67. These two transformed parameters, log2 R ratio and B allele frequency, are then plotted along the entire genome for all SNPs on the array.
Figure 2.
Figure 2.
X-copy cell lines as a model system. Single copy deletions, monoallelic duplications (trisomies), and amplifications are detected on the Human-1 (109K) BeadChip using cell lines with one to four X chromosomes. All plots are shown juxtaposed to normal genome profiles from chromosome 10. (A) In XY, the presence of a single X chromosome is shown as a decrease in the log2 R ratio from ∼0to −0.55, and in the AF plot where the heterozygous state completely collapses to the homozygous axis. Note the pseudoautosomal regions on the Y chromosome. (B) In XX, the presence of the expected two copies of the X chromosome show no deflection in the log R ratio (∼0), and the heterozygotes are clustered around +0.5. (C) In XXX, the log2 R ratio increases from ∼0 to +0.395, and the heterozygous state splits into two clusters, one located at 0.67 (2:1 ratio) and the other at 0.33 (1:2 ratio). (D) In XXXX, the log2 R ratio increases to +0.53, and the heterozygous state is divided into three populations (0.25, 0.51, and 0.76) with allelic ratio of 3:1, 2:2, and 1:3, respectively. (E) The response of the log R ratio for both the X chromosome and chromosome 10 for each X-copy number cell line. The log R ratio increases with increasing X-copy number for the X chromosome but not for chromosome 10. The corresponding standard deviation is shown for each data point. (F) The log R ratio response calculated for the X-copy cell lines with a 10-SNP moving average. Note that the standard deviation has been significantly reduced. For all genomic profiles, the blue line indicates a 500-kb moving median for the Human-1 (109K) BeadChip. The complete X-copy cell line data set, cluster information, and receiver operator plots are available in the Supplemental material.
Figure 3.
Figure 3.
Examples of aberrations using HL-60 on the 109K BeadChip. The human promyelocytic leukemia cell line (HL-60) contains several well-characterized chromosomal aberrations. (A) An example of several discrete monoallelic amplifications across an ∼4.5-Mb region on chromosome 8 (green bar). The monoallelic amplification is evidenced by an increase in the log R ratio and the large split in the allele frequency. Based on the allelic ratios of ∼0.1 and ∼0.9, the level of amplification is on the order of five-to 10-fold. (B) Two deletions found on chromosome 9 (red bars). The first, which is ∼21 Mb, is detected by a deflection in the log R ratio and the collapse of heterozygotes in the allele frequency. The second deletion (∼2.4 Mb) was also detected using the same parameters. (C) The entire length of chromosome 18 (∼76 Mb) is duplicated (black bar), inferring a total copy number of 3. Notice the increase of the log R ratio to ∼0.5 and the cluster split in AF. (D) SNP-CGH arrays can detect a copy-neutral LOH event such as recombination or gene conversion. A small region on chromosome
Figure 4.
Figure 4.
Verification of a chromosomal deletion with BAC array-CGH and FISH. We performed a blinded study on samples collected from patients with developmental clinical phenotypes previously characterized by karyotype, FISH, and BAC array-CGH analysis. (A) Data from a chromosomal BAC microarray showing the mean values of signal to noise (T/R) ratio and error bars of data from two separate hybridizations. The profile shown here represents an enlarged section of a chromosomal microarray showing a loss of three clones in the DiGeorge syndrome I critical region (encircled in red). (B) List of BAC clones, their location, and the log2 R ratio, indicating a loss of copy number in this region (three clones denoted in red). One additional clone shows a potential amplification present in another position in the genome (denoted in green; plots not shown). (C) FISH analysis using the F5 clone (for the DiGeorge region) showing one signal in red while the control probe in green shows two signals, confirming a deletion in the DiGeorge critical region. FISH analysis using the RP11-165F18 clone (distal to F5) shows no deletion. (D) The same aberration, an ∼1.5-Mb deletion on chromosome 22q11.2, detected by SNP-CGH on the Human-1 (109K) array as seen by the deflection in the log R ratio and the loss of heterozygote data points in the AF. (E) The same deletion on chromosome 22q11.2 detected by SNP-CGH on the HumanHap300 (317K) array. Notice the higher density of SNPs in this region on the HumanHap300 BeadChip. This finding confirms the deletion known to be present in the critical region of the DiGeorge syndrome. (F) Another deletion detected on chromosome 22q11.21 that is difficult to discern with the Human-1, which was not detected with any other method. (G) The same deletion can clearly be visualized with the HumanHap300 BeadChip, especially by the deflection in the log R ratio. For all plots, the blue line indicates a 500-kb and a 100-kb moving median, for the Human-1 and HumanHap300 BeadChips, respectively.
Figure 5.
Figure 5.
Analyzing heterogeneous tumor samples. DNA from a tumor cell line was mixed with matched normal DNA at ratios of 0%, 25%, 50%, 75%, and 100% and analyzed on the Human-1 (109K) BeadChip. The genome profile of chromosome 13 is shown as an example. (A) No aberrations are seen in the sample containing 100% normal gDNA. (B) No discernable differences in the log R ratio are seen in a sample composed of 75% normal and 25% tumor. It is also difficult to determine if there are any changes in the allelic frequency. (C) At 50% normal and 50% tumor DNA, deflections in the log R ratio appear. Changes in the AF are also seen, although it is difficult to establish the nature of each aberration. At these levels, an allelic duplication event and allelic LOH bear resemblance to each other. (D) At 25% normal and 75% tumor gDNA, the nature of each type of aberration becomes more apparent. For example, the large decrease in the log R ratio in the center of the plot denotes a potential region with a deletion, which was not easily discernable in C. (E) The genoplot from a pure (100%) tumor sample. A homozygous deletion can be seen in the center of the plot, visualized by a decrease in the log R ratio. (F) A region exhibiting LOH is observed on chromosome 3 in a paired colon tumor patient sample analyzed on the HumanHap300 BeadChip. A decrease in the log R ratio indicates a loss of copy number. The AF is divided into two populations(∼0.33 and ∼0.67), suggesting that this sample contains ∼67% normal cells. The blue line shown for all log R ratio profiles indicates a 250-kb and a 100-kb moving median for the Human-1 and HumanHap300 BeadChips, respectively.
Figure 6.
Figure 6.
Effect of gDNA quantity and fragmentation on SNP-CGH data. SNP-CGH data quality as a function of the quantity and fragmentation length of gDNA in the amplification reactions was tested using a multisample 10K BeadChip format. (A) Various lengths of fragmented DNA were used as starting input for the whole-genome amplification reaction (Fragments 1, 2, and 3). (B) The call rate is relatively insensitive to input amount across the entire range of 200 ng to 3 ng or fragment length. The call rates for input DNA ranging from 25 to 200 ng were all above 0.999, and the call rates for the 3–12.5 ng were all above 0.996. (C) Genomic DNA was titrated from the standard 1× input (200 ng in a one-quarter scale reaction) down to 1/64th input (3 ng in a one-quarter scale reaction) as well as Fragments 1, 2, and 3. As the levels of input DNA decreased, the variability in the log R ratio noticeably increased, whereas the allelic ratio was relatively insensitive to input amounts. (D) The R 2 correlation between samples remains high when similar amounts of gDNA are used for input regardless if it falls into either high or low levels; however, the R 2 decreases dramatically between inputs that differ substantially in amount. (E) An example genome profile from chromosome 1 showing both the log R ratio and AF from the sample using 200 ng of input DNA. (F) The same plot as in E but with 3 ng of input DNA. Notice the slight increase in log R ratio variability with the lower amount of DNA input.
Figure 7.
Figure 7.
Paired versus single sample analysis. Varying starting inputs of DNA (10 ng and 750 ng) from a paired breast tumor cell line were hybridized to a multisample BeadChip containing a subset of loci (∼33,000) from the HumanHap300 product. In addition, Phi29 was used to amplify 10 ng of gDNA, and 750 ng of this amplified product was used in the initial whole-genome amplification step. Overall, we find that the effect of different inputs of gDNA on the resulting genomic profiles is ameliorated by paired-sample analysis. (A) In the single sample mode, the variability (standard deviation) in the log R ratio is shown as gray dots for Phi29-amplified gDNA, 10 ng of input DNA, and 750 ng of input gDNA (from top to bottom). (B) In the paired-sample mode, the variation in the log R ratio across chromosome 8 is reduced for the same samples. For reference, the AF for the tumor sample is shown on the bottom left and the |Allele Freq subject-reference| for the same tumor sample with paired analysis is shown on the bottom right. Using paired-sample analysis, the allele frequency difference between normal and tumor genotypes is very distinct. Where applicable, a 500-kb moving median was used (blue line).

Similar articles

Cited by

References

    1. Abeln E.C., Corver W.E., Kuipers-Dijkshoorn N.J., Fleuren G.J., Cornelisse C.J., Corver W.E., Kuipers-Dijkshoorn N.J., Fleuren G.J., Cornelisse C.J., Kuipers-Dijkshoorn N.J., Fleuren G.J., Cornelisse C.J., Fleuren G.J., Cornelisse C.J., Cornelisse C.J. Molecular genetic analysis of flow-sorted ovarian tumour cells: Improved detection of loss of heterozygosity. Br. J. Cancer. 1994;70:255–262. - PMC - PubMed
    1. Albertson D.G., Pinkel D., Pinkel D. Genomic microarrays in human genetic disease and cancer. Hum. Mol. Genet. 2003;12:R145–R152. - PubMed
    1. Albertson D.G., Collins C., McCormick F., Gray J.W., Collins C., McCormick F., Gray J.W., McCormick F., Gray J.W., Gray J.W. Chromosome aberrations in solid tumors. Nat. Genet. 2003;34:369–376. - PubMed
    1. Altshuler D., Brooks L.D., Chakravarti A., Collins F.S., Daly M.J., Donnelly P., Brooks L.D., Chakravarti A., Collins F.S., Daly M.J., Donnelly P., Chakravarti A., Collins F.S., Daly M.J., Donnelly P., Collins F.S., Daly M.J., Donnelly P., Daly M.J., Donnelly P., Donnelly P. A haplotype map of the human genome. Nature. 2005;437:1299–1320. - PMC - PubMed
    1. Barrett M.T., Scheffer A., Ben-Dor A., Sampas N., Lipson D., Kincaid R., Tsang P., Curry B., Baird K., Meltzer P.S., Scheffer A., Ben-Dor A., Sampas N., Lipson D., Kincaid R., Tsang P., Curry B., Baird K., Meltzer P.S., Ben-Dor A., Sampas N., Lipson D., Kincaid R., Tsang P., Curry B., Baird K., Meltzer P.S., Sampas N., Lipson D., Kincaid R., Tsang P., Curry B., Baird K., Meltzer P.S., Lipson D., Kincaid R., Tsang P., Curry B., Baird K., Meltzer P.S., Kincaid R., Tsang P., Curry B., Baird K., Meltzer P.S., Tsang P., Curry B., Baird K., Meltzer P.S., Curry B., Baird K., Meltzer P.S., Baird K., Meltzer P.S., Meltzer P.S., et al. Comparative genomic hybridization using oligonucleotide microarrays and total genomic DNA. Proc. Natl. Acad. Sci. 2004;101:17765–17770. - PMC - PubMed

Publication types

LinkOut - more resources