. 2006 Aug 9;26(32):8339-51.
doi: 10.1523/JNEUROSCI.0472-06.2006.

Activity bidirectionally regulates AMPA receptor mRNA abundance in dendrites of hippocampal neurons

Affiliations

Activity bidirectionally regulates AMPA receptor mRNA abundance in dendrites of hippocampal neurons

Sonja Y Grooms et al. J Neurosci. .

Abstract

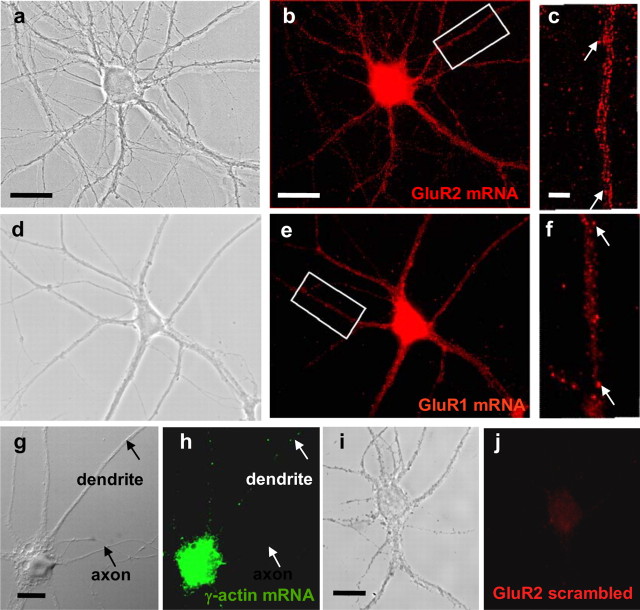
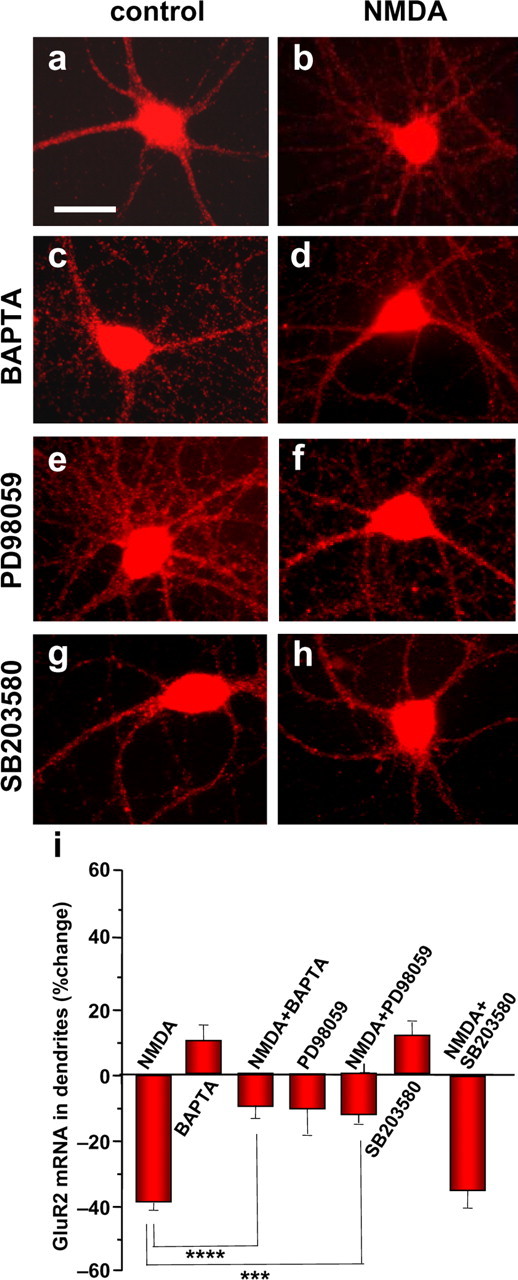
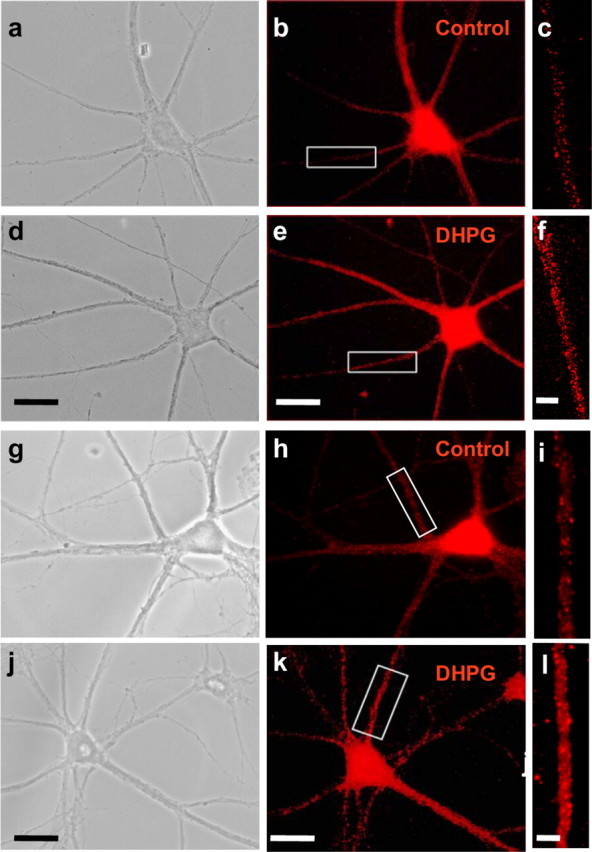
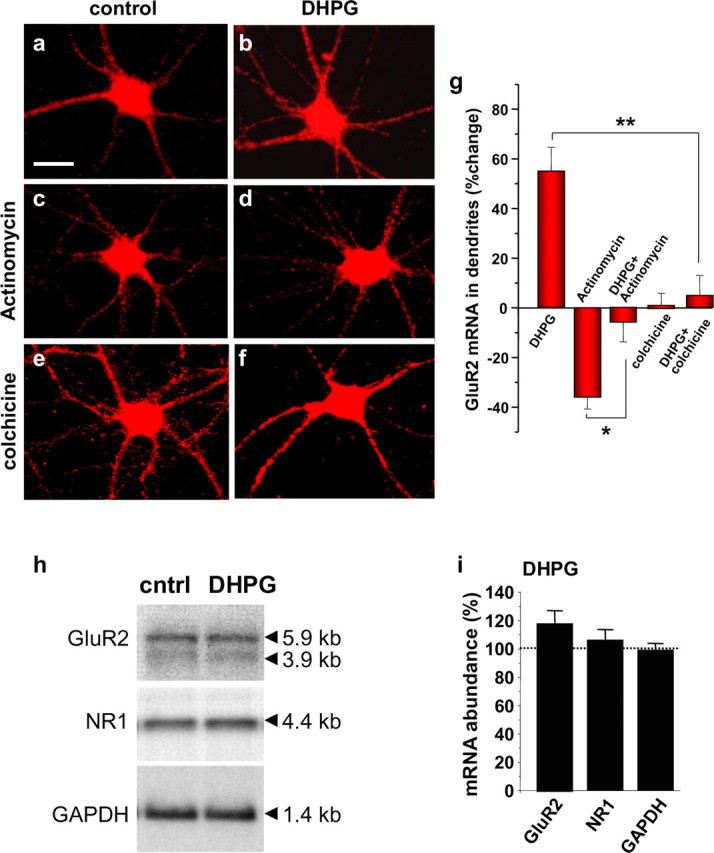
Activity-dependent regulation of synaptic AMPA receptor (AMPAR) number is critical to NMDA receptor (NMDAR)-dependent synaptic plasticity. Using quantitative high-resolution in situ hybridization, we show that mRNAs encoding the AMPA-type glutamate receptor subunits (GluRs) 1 and 2 are localized to dendrites of hippocampal neurons and are regulated by paradigms that alter synaptic efficacy. A substantial fraction of synaptic sites contain AMPAR mRNA, consistent with strategic positioning and availability for "on-site" protein synthesis. NMDAR activation depletes dendritic levels of AMPAR mRNAs. The decrease in mRNA occurs via rise in intracellular Ca2+, activation of extracellular signal-regulated kinase/mitogen-activated protein kinase signaling, and transcriptional arrest at the level of the nucleus. The decrease in mRNA is accompanied by a long-lasting reduction in synaptic AMPAR number, consistent with reduced synaptic efficacy. In contrast, group I metabotropic GluR signaling promotes microtubule-based trafficking of existing AMPAR mRNAs from the soma to dendrites. Bidirectional regulation of dendritic mRNA abundance represents a potentially powerful means to effect long-lasting changes in synaptic strength.


Figures

Figure 1.
Figure 1.
GluR2 mRNA is highly clustered in proximal and distal dendrites of neurons. a–c, Localization of GluR2 mRNA in hippocampal neurons visualized by high-resolution FISH. a, Phase-contrast image of a cultured hippocampal neuron at 21 DIV. b, GluR2 mRNA appeared as fluorescent clusters extending into proximal and distal processes. The mRNA clusters resembled RNA granules or packets, implicated in RNA transport in neurons. c, Enlarged view of boxed segment in b; arrows denote spine-like protrusions. d, Phase-contrast image of a cultured hippocampal neuron. e, GluR1 exhibited a granular organization similar to that observed for GluR2 mRNA. f, Enlarged view of boxed segment in e; arrows denote spine-like protrusions. g, Phase-contrast image of a cultured hippocampal neuron. h, γ-Actin mRNA fluorescence in the same neuron as in g was confined to cell somata, with little labeling in neuronal processes. i, Phase-contrast image of a cultured hippocampal neuron. j, Hybridization with a randomized GluR2 probe of the same neuron as in i showed no detectable labeling in the soma or dendrites. Scale bars: a, b, 25 μm; c, 5 μm; g, i, 20 μm.
Figure 2.
Figure 2.
GluR2 mRNA clusters localize to dendritic shaft and postsynaptic structures. GluR2 mRNA (a) and MAP2 label (b) fill the shafts of dendritic processes; GluR2 mRNA clusters decorate proximal and distal segments of MAP2-filled dendrites (merge, c). Some GluR2 mRNA clusters (but not MAP2 label) appear to emanate from the dendritic shaft and localize to the heads of spine-like protrusions (a, c, arrows). d, Phase-contrast image of a cultured hippocampal neuron. e, Merge of GluR2 mRNA (red) and synapsin-1 protein (green) for neuron shown under phase optics in d. GluR2 mRNA clusters colocalize with synapsin-1 puncta, indicating the presence of abundant GluR2 mRNA at and near to synaptic sites. Inset, Enlarged view of boxed segment in e. A number of GluR2 mRNA clusters localize in close proximity with synapsin puncta, indicating localization opposite presynaptic terminals (arrows). f, Quantitation of juxtaposition of GluR2 mRNA clusters and synapsin-1 puncta. Approximately 26% of synapses (marked by synapsin-1) contain GluR2 mRNA clusters (n = 29 cells from 5 independent experiments). Approximately 12% of GluR2 mRNA clusters localize opposite synapsin puncta (n = 29 cells from 5 independent experiments). Scale bars: a–c, 20 μm; insets, 2 μm; d, e, 25 μm; inset, 5 μm.
Figure 3.
Figure 3.
NMDAR activation promotes loss of dendritic GluR1 and GluR2 (but not NR1) mRNAs. a, GluR2 mRNA localization in the soma and dendrites of a control (vehicle-treated) hippocampal neuron at 21 DIV. b, Application of 50 μm NMDA (plus 100 μm CNQX, 1 min), followed by additional incubation for a total of 30 min in the presence of d-APV and CNQX, caused a prominent loss of GluR2 mRNA fluorescence (intensity and number of GluR2 mRNA clusters) in proximal and distal dendrites, assessed by Q-FISH at 30 min after initiation of drug treatment, with little or no change in soma. c, GluR1 mRNA localization in the soma and dendrites of a control hippocampal neuron from the same batch as in a and b. d, NMDA produced a marked decrease in GluR1 mRNA fluorescence in dendrites, assessed by Q-FISH at 30 min after initiation of drug treatment. e, NR1 localization in the soma and dendrites of a control hippocampal neuron. NR1 mRNA clusters were abundant in cell somata and throughout shafts of proximal and distal dendrites of a control (vehicle-treated) hippocampal neuron at 14 DIV. f, NMDA did not significantly alter NR1 mRNA fluorescence in dendrites of a hippocampal neuron, assessed at 30 min. g, Quantitation of data from images like those illustrated in a–f. Data represent the percentage change in the mean integrated intensity values per designated area of interest. Error bars represent SEM (***p ≤ 0.001). Scale bars: a–d, 25 μm; e, f, 15 μm; insets, 2 μm.
Figure 4.
Figure 4.
NMDA-induced loss of dendritic GluR2 mRNA requires Ca2+ and MAPK signaling. a, Representative images showing control (a, c, e, g) and NMDA-treated (b, d, f, h) neurons preincubated with vehicle (a, b), the cell-permeant Ca2+ chelator BAPTA-AM (c, d), the ERK/MAPK inhibitor PD98059 (e, f), and the p38 MAPK inhibitor SB203580 (g, h). a, b, NMDA (30 s) promoted loss/removal of GluR2 mRNA fluorescence in dendrites, as assessed by Q-FISH at 30 min after initiation of drug treatment. c–h, The NMDA-induced loss of GluR2 mRNA was markedly inhibited by BAPTA-AM (c, d) and PD98059 (e, f) but not by SB203580 (g, h), indicating that an elevation of intracellular Ca2+ and ERK/MAPK (but not p38 MAPK) signaling are critical to the NMDA effect. BAPTA-AM (c), PD98059 (e), and SB203580 (g) alone did not significantly alter GluR2 mRNA levels in dendrites or soma. i, Quantitation of data from images like those illustrated in a–h. NMDA treatment was as described in the legend to Figure 3. Drug treatments were as described in Materials and Methods. Error bars represent SEMs for 5–11 independent experiments (***p ≤ 0.001; ****p < 0.0005). Scale bar, 20 μm.
Figure 5.
Figure 5.
NMDAR activation regulates total GluR2 mRNA abundance but does alter mRNA stability. a, Representative Northern blot analysis of mRNA samples from control (cntrl) and NMDA-treated cortical neurons (see Materials and Methods). b, Quantitation of data. Brief stimulation with NMDA (50 μm, 60 s) in the presence of CNQX reduced cellular GluR1 and GluR2, but not NR1 or GAPDH, mRNA content in neurons, assessed at 30 min after initiation of drug application. c–e, Representative Northern blots and decay rates of GluR2 (c), NR1 (d), and GAPDH (e) mRNAs in the presence of the transcriptional inhibitor actinomycin D or after NMDA treatment in the presence of actinomycin D. c, In the presence of actinomycin D, GluR2 mRNA exhibited a relatively rapid rate of constitutive decay relative to that of NR1 (d) or GAPDH (e) mRNA. NMDA did not significantly alter the constitutive decay of GluR2, NR1, or GAPDH mRNA observed in the presence of actinomycin D, indicating no detectable effect on mRNA stability. Error bars represent SEMs for four independent experiments (**p ≤ 0.01).
Figure 6.
Figure 6.
Actinomycin D mimics and occludes the NMDA-induced decrease in dendritic GluR2 mRNA. a–g, Representative images showing GluR2 mRNA in control (a, c, e, g) and NMDA-treated (b, d, f) neurons after preincubation with the transcription inhibitor actinomycin D (c, d), the microtubule- depolymerizing agent colchicine (e, f) or actinomycin D and colchicine (g), assessed by Q-FISH at 30 min after initiation of drug application. c, d, The transcriptional inhibitor actinomycin D decreased dendritic GluR2 mRNA to nearly the same extent as NMDA (b) and occluded additional reduction of GluR2 mRNA abundance by NMDA (d). Colchicine did not detectably alter GluR2 mRNA abundance in dendrites but strikingly inhibited the NMDA- and actinomycin D-induced loss/removal of GluR2 mRNA from dendrites (f). h, Quantitation of data. Drug treatments were as described in Materials and Methods. Error bars represent SEMs for 4–12 independent experiments (**p ≤ 0.01). Scale bars: a, 20 μm; inset, 2 μm.
Figure 7.
Figure 7.
Group I mGluR1 activation enhances levels of GluR2 and GluR1 mRNA in dendrites. a–f, Representative images showing GluR2 mRNA in control (b, c) and DHPG-treated (e, f) neurons, as assessed by Q-FISH at 30 min after initiation of drug treatment. DHPG (25 μm plus 50 μm d-APV and 100 μm CNQX) was applied for 15 min. b, e, GluR2 mRNA fluorescence is prominent in the soma and dendrites of the same neurons shown under phase optics in a and d, respectively. c, f, Enlarged view of areas indicated in boxes in b and e, respectively. g–l, Representative images showing GluR1 mRNA fluorescence in a control (g–i) and DHPG-treated (j–l) neuron, as assessed by Q-FISH at 30 min after initiation of drug treatment. h, k, GluR1 mRNA fluorescence in the soma and dendrites of the same neurons shown under phase optics in g and j, respectively. i, l, Enlarged view of areas indicated in boxes in h and k, respectively. Activation of group I mGluRs markedly enhanced GluR2 and GluR1 mRNA fluorescence intensity in proximal and distal dendrites of hippocampal neurons, with no significant change in cell soma. Error bars represent SEMs for 10 (GluR2 mRNA) and 3 (GluR1 mRNA) independent experiments, each involving a minimum of 20 cells per treatment group (**p ≤ 0.01). Scale bars: b, e, h, k, 20 μm; c, f, i, l, 2 μm.
Figure 8.
Figure 8.
mGluR-induced increase in dendritic GluR2 mRNA involves regulated mRNA transport. a–f, Representative images showing GluR2 mRNA in control (a, c, e) and DHPG-treated (b, d, f) neurons pretreated with vehicle (a, b), the transcriptional inhibitor actinomycin D (c, d) and the microtubule-depolymerizing agent colchicine (e, f). g, Quantitation of data. Drug treatments were as described in Materials and Methods. b, DHPG (15 min) markedly enhanced GluR2 mRNA fluorescence in dendrites relative to that of control neurons (a), as assessed by Q-FISH at 30 min after initiation of DHPG application. c, Actinomycin D reduced fluorescence signal in dendrites. d, DHPG markedly increased GluR2 mRNA fluorescence in dendrites relative to that observed in the presence of actinomycin D alone. e, f, Colchicine did not detectably alter dendritic GluR2 mRNA fluorescence in dendrites or soma but markedly inhibited the DHPG-induced increase in GluR2 mRNA in dendrites. g, Quantitation of data. Error bars represent SEMs for four to six independent experiments. Scale bar, 20 μm. h, Representative Northern blot analysis of mRNA samples from control (cntrl) and DHPG-treated cortical neurons (see Materials and Methods). i, Quantitation of data. Stimulation with DHPG (25 μm, 15 min) in the presence of 50 μm d-APV and 100 μm CNQX did not significantly alter cellular GluR2, NR1, or GAPDH mRNA content in neurons, assessed at 30 min after initiation of drug application. Error bars represent SEMs for four independent experiments. *p < 0.05; **p < 0.01. Scale bar (in a), 25 μm.
Figure 9.
Figure 9.
NMDAR activation induces a long-lasting decrease in synaptic AMPAR number. a–d, Representative images showing surface GluR2 (red) and synapsin-1 (green) protein immunolabeling in neurons at 4 h after treatment with vehicle(a), NMDA (b), actinomycin D (c), and NMDA (d) in the presence of actinomycin D. e, Time course of surface and total GluR2 protein in dendrites after treatment with NMDA. f, Quantitative analysis of total GluR2 protein abundance in dendrites at 4 h after NMDA, actinomycin D, NMDA plus actinomycin D, emetine, and NMDA plus emetine. g, Quantitative analysis of synaptic GluR2 assessed in images like those in a–d. NMDAR stimulation (30 s) markedly reduced surface and total GluR2 protein abundance in dendrites, with little or no change in soma (b, e, f). NMDA did not detectably alter NR1 protein fluorescence in dendrites (data not shown). Emetine and actinomycin D mimicked and occluded the NMDA-induced loss of GluR2 protein in dendrites (f) and synaptic sites (g). Drug treatments were as described in Materials and Methods. Data represent the percentage change in the mean integrated intensity values per designated area of interest for a minimum of four independent experiments. Error bars represent SEMs (**p ≤ 0.01). Scale bars: a–d, 10 μm; insets, 2 μm.

Similar articles

Cited by

References

    1. Allen MP, Xu M, Zeng C, Tobet SA, Wierman ME (2000). Myocyte enhancer factors-2B and -2C are required for adhesion related kinase repression of neuronal gonadotropin releasing hormone gene expression. J Biol Chem 275:39662–39670. - PubMed
    1. Aronov S, Marx R, Ginzburg I (1999). Identification of 3′UTR region implicated in tau mRNA stabilization in neuronal cells. J Mol Neurosci 12:131–145. - PubMed
    1. Barry MF, Ziff EB (2002). Receptor trafficking and the plasticity of excitatory synapses. Curr Opin Neurobiol 12:279–286. - PubMed
    1. Bassell GJ, Zhang H, Byrd AL, Femino AM, Singer RH, Taneja KL, Lifshitz LM, Herman IM, Kosik KS (1998). Sorting of β-actin mRNA and protein to neurites and growth cones in culture. J Neurosci 18:251–265. - PMC - PubMed
    1. Beattie EC, Carroll RC, Yu X, Morishita W, Yasuda H, von Zastrow M, Malenka RC (2000). Regulation of AMPA receptor endocytosis by a signaling mechanism shared with LTD. Nat Neurosci 3:1291–1300. - PubMed

Publication types