Review
. 2006 Aug 9;25(15):3480-93.
doi: 10.1038/sj.emboj.7601227.

Imaging of cell migration

Affiliations
Review

Imaging of cell migration

Dirk Dormann et al. EMBO J. .

Abstract

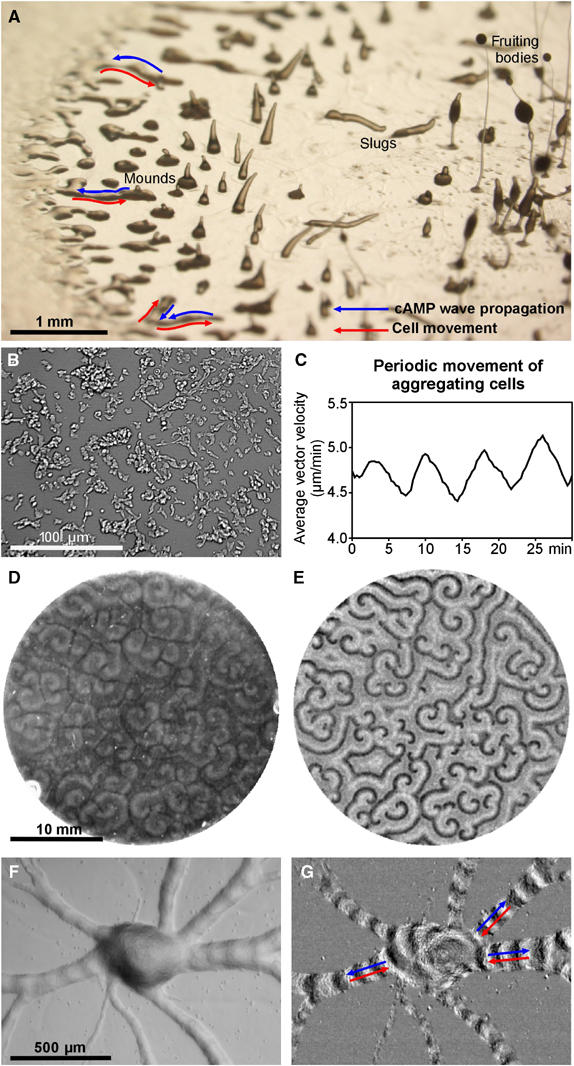
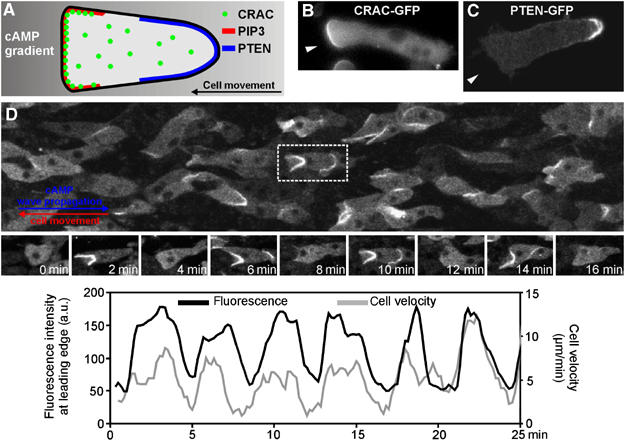
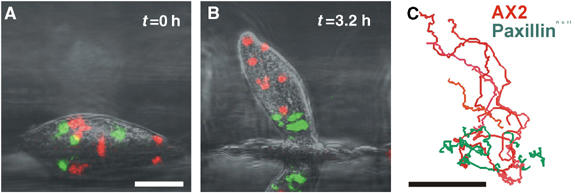
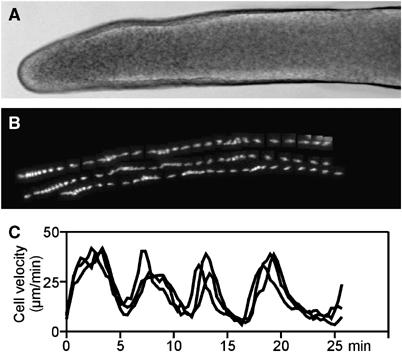
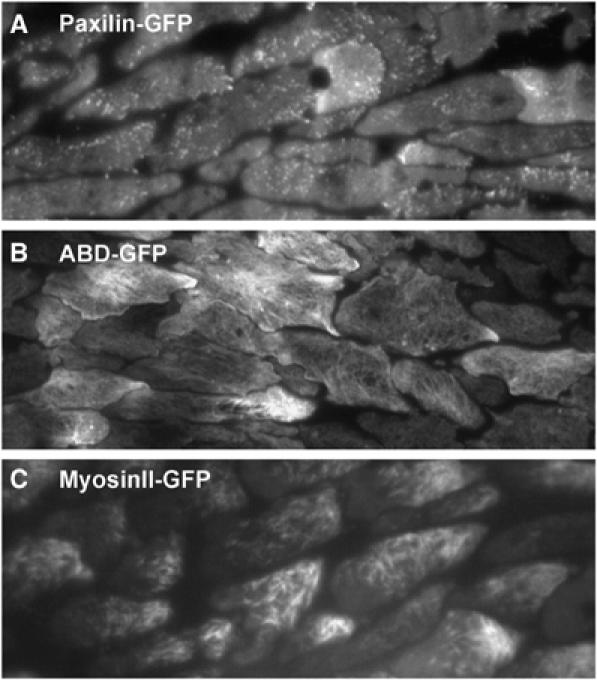
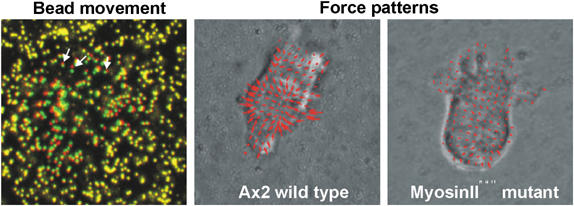
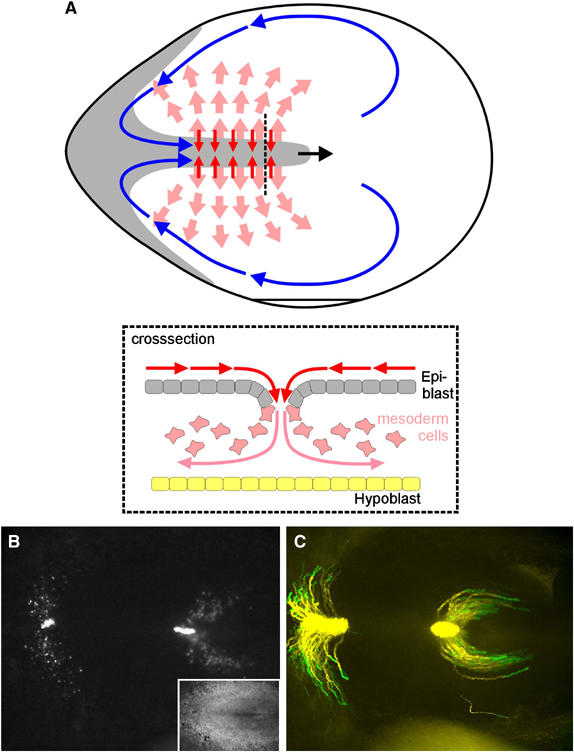
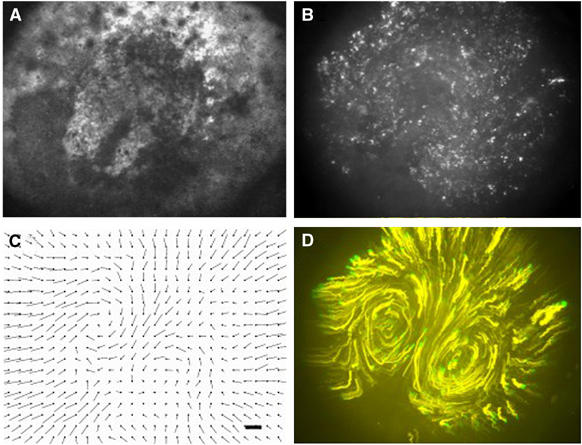
Cell migration is an essential process during many phases of development and adult life. Cells can either migrate as individuals or move in the context of tissues. Movement is controlled by internal and external signals, which activate complex signal transduction cascades resulting in highly dynamic and localised remodelling of the cytoskeleton, cell-cell and cell-substrate interactions. To understand these processes, it will be necessary to identify the critical structural cytoskeletal components, their spatio-temporal dynamics as well as those of the signalling pathways that control them. Imaging plays an increasingly important and powerful role in the analysis of these spatio-temporal dynamics. We will highlight a variety of imaging techniques and their use in the investigation of various aspects of cell motility, and illustrate their role in the characterisation of chemotaxis in Dictyostelium and cell movement during gastrulation in chick embryos in more detail.


Figures

Figure 1
Figure 1
Cell movement and cAMP wave propagation in aggregating Dictyostelium cells. (A) View of a Dictyostelium colony growing on a bacterial agar plate. Cells at the left are vegetative and feeding on bacteria, behind the feeding front the cells start to aggregate in aggregation streams. In the middle the aggregates develop into mounds and standing slugs and towards the right there are a few fruiting bodies, consisting of a stalk that supports a mass of spores. Blue arrows indicate the direction of wave propagation, while red arrows indicate the direction of cell movement. (B) Dictyostelium cells aggregating on a coverslip submerged in phosphate buffer 5 h after the onset of starvation. Cells communicate by propagating cAMP waves that cause the coordinated chemotactic response of cells towards the cAMP source. (C) Measuring the optical flow over the entire image and calculating the average vector velocity reveals the periodic movement of the cells in response to cAMP waves. (D) Dictyostelium cells that have been plated in a monolayer on agar show the characteristic macroscopic dark field waves that correspond to the relayed cAMP waves. (E) Subtraction of subsequent images highlights the differences between the images and enhances the visibility of the rapidly moving dark field waves. Same field of view as in (D). (F) Cells continue to move towards the aggregations centres/mounds in long streams. (G) Image subtraction shows again the propagated wave fronts that move away from the centre while the cells move in the opposite direction (see Supplementary Movies 1, 2 and 3).
Figure 2
Figure 2
Periodic translocation of PIP3 binding PH domains to the leading edge. (A) Schematic diagram of a cell migrating from right to left in a gradient of cAMP. The process of signal detection involves binding of cAMP to cell surface receptors, reflecting the gradient in cAMP. This results in localised PIP3 production in the leading edge (red), which acts as a docking site for PIP3 specific PH domain containing proteins such as CRAC (green). The PIP3 gradient is the result of the translocation of PI3 kinase to the front and dissociation of the PIP3 3-phosphatase PTEN (blue) from the front, while remaining membrane bound in the back where it degrades PIP3. (B) Cell moving chemotactically in a cAMP gradient from right to left showing the binding of GFP tagged CRAC to the front of the cell. (C) Cell moving chemotactically in a cAMP gradient from right to left showing the binding of GFP tagged PTEN to the plasma membrane in the rear of the cell. (D) Cells moving in an aggregation stream. Cell express the PIP3 binding PH domain of CRAC fused to GFP, which translocates to the leading edge in response to the external cAMP waves. The red arrow shows the direction of cell movement and the blue arrow shows the direction of signal propagation. Snapshots of the highlighted cell taken at 2-min intervals show the changes in membrane translocation of CRAC-GFP and cell shape as cAMP waves sweep across the cells in the aggregation stream. The graphs show the fluorescence changes at the leading edge (measured in a 10 × 10 pixel window at the anterior plasma membrane), indicating the periodic production of PIP3 at this site which also correlates with the changes in cell velocity (see Supplementary Movie 4).
Figure 3
Figure 3
Cell sorting during slug formation. (A) Side view of a mound of wild-type cells containing a small number of fluorescently labelled wild-type cells (red) and fluorescently labelled PaxBnull cells. Scale bar: 50 μm. (B) As the mound transforms into a slug, the dispersed paxBnull cells are restricted to the posterior of the forming slug. (C) The corresponding cell traces of paxBnull cells (green, n=7 cells) and Ax2 cells (red, n=7) indicate reduced motility and directionality of paxBnull cells during slug formation. Scale bar: 50 μm (see Supplementary Movie 5).
Figure 4
Figure 4
Periodic cell movement at the slug stage of development. The cAMP waves that coordinate cell movement in the slug are initiated in the slug tip (A: brightfield image of a slug) and relayed along the length of the slug causing periodic surges in cell velocity as can be seen in the tracks of the three GFP labelled cells (B) and in the corresponding velocity plots (C) (see Supplementary Movie 6).
Figure 5
Figure 5
Visualising the localisation of cytoskeletal components using TIRF microscopy. (A) PaxillinGFP accumulates at focal adhesion sites that remain stationary once they have been formed. Shown is the ventral membrane of cells moving in aggregation streams under TIRF illumination (see Supplementary Movie 7). (B) Using the f-actin specific ABD-GFP, the dynamics of the actin cytoskeleton can be studied in great detail. Filamentous actin structures are clearly visible in the cortex of the slug cells (see Supplementary Movie 8). (C) MyosinII-GFP marks the cellular localisation of myosin II, which is involved in the contraction of the cell posterior through interaction with the actin cytoskeleton. As can be seen MyosinII-GFP filaments are absent from the leading edge of slug cells (see Supplementary Movie 9).
Figure 6
Figure 6
Measuring forces in migrating cells. The forces cells exert on their substrate can be deduced from the analysis of the displacement of fluorescently labelled beads that are embedded in an elastic substratum over which the cells move. Beads that have been moved by a migrating cell are indicated by the red and green colours (arrows), while stationary beads further away from the cell appear in yellow. The calculated force patterns are shown for a wild-type Ax2 cell and a MyosinIInull cell both moving in a cAMP gradient.
Figure 7
Figure 7
Migration of mesoderm cells in a HH4 chick embryo. (A) Schematic diagram of a chick embryo. Cells in the epiblast migrate (red arrows) to the forming primitive streak. There they undergo an epithelial to mesenchymal transition and move (roza arrows) in the space between the epiblast and hypoblast (insert), where they migrate over large distances to form mesodermal structures such as somites, lateral plate mesoderm and blood islands. The streak itself forms from the posterior end of the embryo towards anterior, involving two counter rotating cell flows of cells in the epiblast that merge at the site of streak formation and indicated schematically by the blue arrows (see Figure 8 for experimental data). (B) GFP expressing cells that have migrated from a graft in the posterior and middle primitive streak, inset with corresponding brightfield image of the same chick embryo. The tip of the primitive streak points to the right. (C) Cell tracks of the cells shown in (A) over a 6-h period, the last 2 h of migration are shown in green (see Supplementary Movie 10).
Figure 8
Figure 8
Movement of tissue in the epiblast of a prestalk chick embryo. (A) Bright field image of an HH1 stage chick embryo, with a streak extending halfway over the epiblast. (B) The same embryo as shown in (A) (9 h after transfection with GFP), every white dot is a singe cell in the epiblast. (C) Vector velocity field calculated from a brightfield sequence as shown in (A), the marker bar indicates a velocity of 1 μm/min. (D) Traces of the fluorescent cells shown in (B), the traces were calculated over a time period of 6 h, the cell migrate in the direction yellow to green, the green track shows migration over the last hour (see Supplementary Movie 11).

References

    1. Abe T, Early A, Siegert F, Weijer C, Williams J (1994) Patterns of cell movement within the Dictyostelium slug revealed by cell type-specific, surface labeling of living cells. Cell 77: 687–699 - PubMed
    1. Adams SR, Campbell RE, Gross LA, Martin BR, Walkup GK, Yao Y, Llopis J, Tsien RY (2002) New biarsenical ligands and tetracysteine motifs for protein labeling in vitro and in vivo: synthesis and biological applications. J Am Chem Soc 124: 6063–6076 - PubMed
    1. Affolter M, Weijer CJ (2005) Signaling to cytoskeletal dynamics during chemotaxis. Dev Cell 9: 19–34 - PubMed
    1. Arai Y, Iwane AH, Wazawa T, Yokota H, Ishii Y, Kataoka T, Yanagida T (2006) Dynamic polymorphism of Ras observed by single molecule FRET is the basis for molecular recognition. Biochem Biophys Res Commun 343: 809–815 - PubMed
    1. Arrieumerlou C, Meyer T (2005) A local coupling model and compass parameter for eukaryotic chemotaxis. Dev Cell 8: 215–227 - PubMed

Publication types

LinkOut - more resources