

Evolutionary patterns in early tetrapods. I. Rapid initial diversification followed by decrease in rates of character change
- PMID: 16901828
- PMCID: PMC1635524
- DOI: 10.1098/rspb.2006.3577
Evolutionary patterns in early tetrapods. I. Rapid initial diversification followed by decrease in rates of character change
Abstract
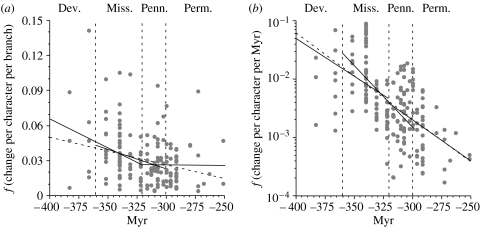
Although numerous studies have examined morphological diversification during major radiations of marine taxa, much less attention has been paid to terrestrial radiations. Here, we examine rates of character change over phylogeny and over time for Palaeozoic limbed tetrapods. Palaeozoic tetrapods show significant decreases in rates of character change whether the rate is measured per sampled cladistic branch or per million years along phylogeny. Given changes per branch, rates decrease significantly from the Devonian through the Pennsylvanian, but not from the Pennsylvanian through the Permian. Given changes per million years, rates decrease significantly over each boundary, although the decrease is least significant over the Pennsylvanian-Permian boundary. Decreasing rates per million years through the Permian might be an artefact of the method being able to ascribe longer durations to Permian branches than to Carboniferous ones; however, it is difficult to ascribe the general pattern of decreasing rates of change over time to sampling biases or methodological biases. Thus, the results implicate biological explanations for this pattern.
Figures
References
-
- Ahlberg P.E, Johanson Z. Osteolepiforms and the ancestry of tetrapods. Nature. 1998;395:792–794.
-
- Anstey R.L, Pachut J.F. Phylogeny, diversity history and speciation in Paleozoic bryozoans. In: Erwin D.H, Anstey R.L, editors. New approaches to studying speciation in the fossil record. Columbia University Press; New York, NY: 1995. pp. 239–284.
-
- Briggs D.E.G, Fortey R.A, Wills M.A. Morphological disparity in the Cambrian. Science. 1992;256:1670–1673. - PubMed
-
- Coates M.I, Clack J.A. Polydactyly in the earliest known tetrapod limbs. Nature. 1990;347:66–69. doi:10.1038/347066a0 - DOI
-
- Coates M.I, Jeffery J.E, Ruta M. Fins to limbs: what the fossils say. Evol. Dev. 2002;4:390–401. doi:10.1046/j.1525-142X.2002.02026.x - DOI - PubMed
Publication types
MeSH terms
LinkOut - more resources
Full Text Sources
