. 2006 Jul;86(1):43-63.
doi: 10.1901/jeab.2006.57-05.

Fix and sample with rats in the dynamics of choice

Affiliations

Fix and sample with rats in the dynamics of choice

Carlos F Aparicio et al. J Exp Anal Behav. 2006 Jul.

Abstract

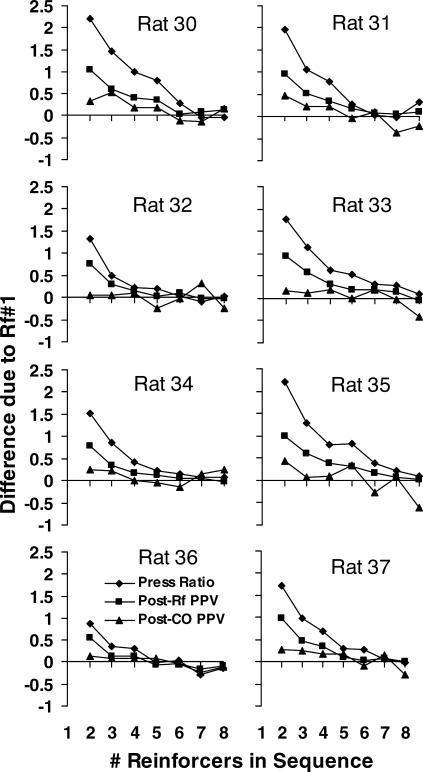
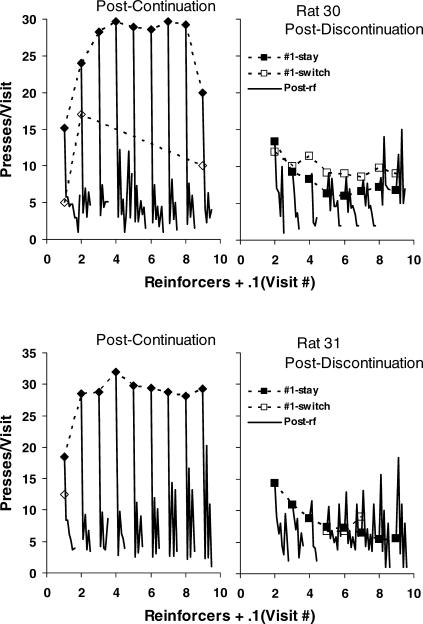
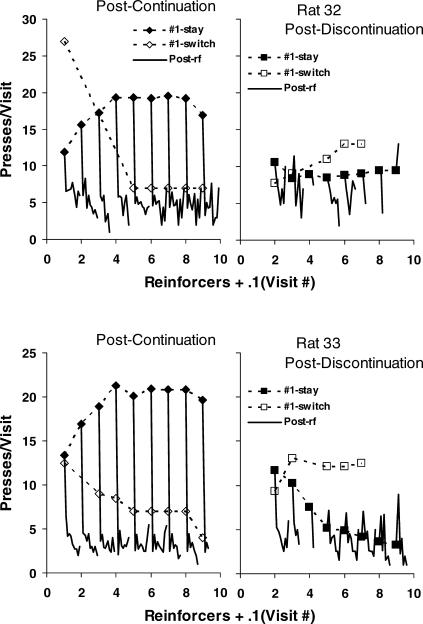
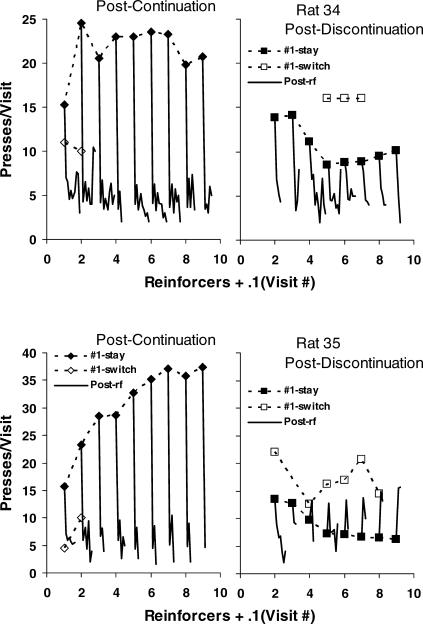
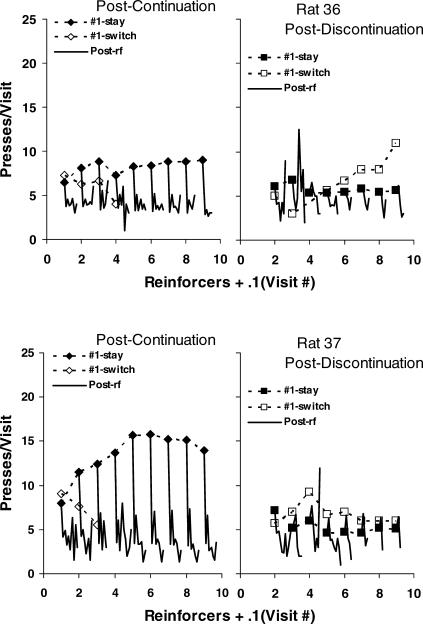
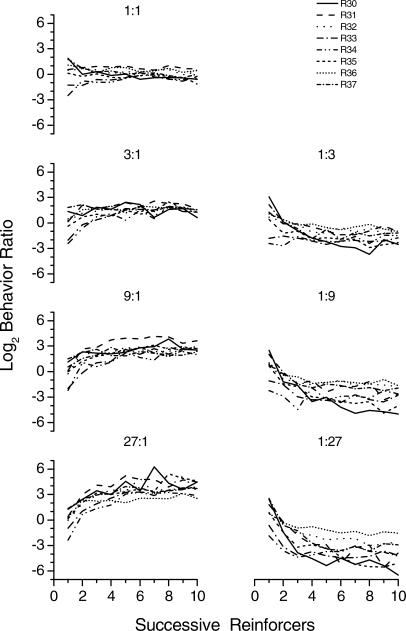
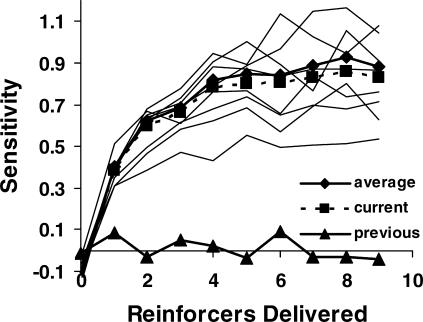
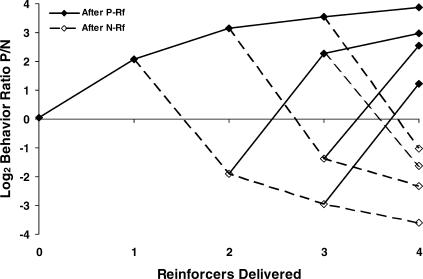
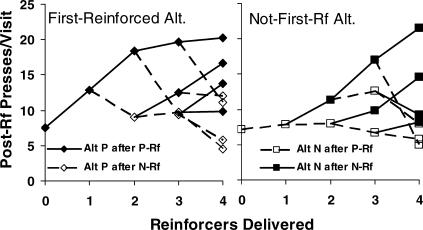
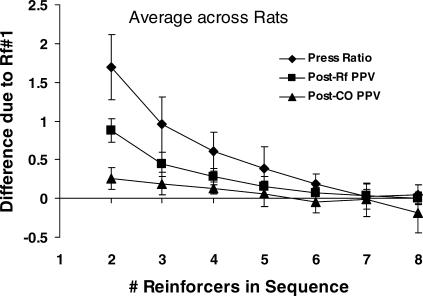
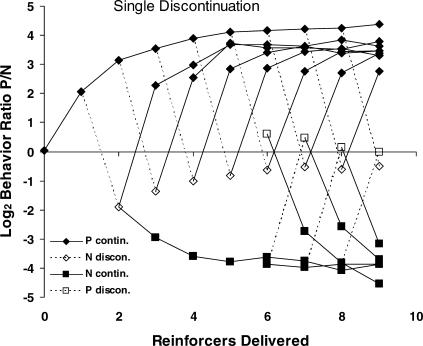
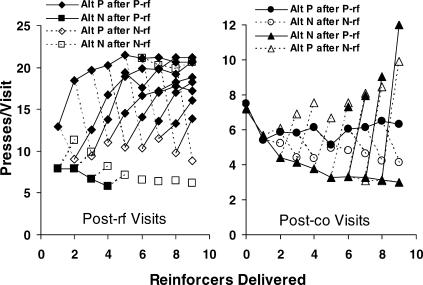
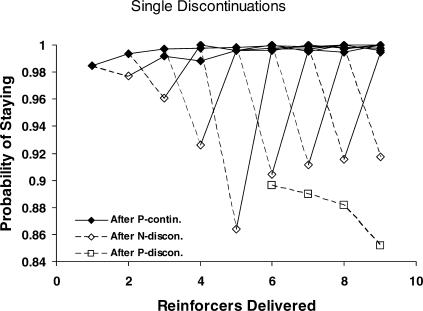
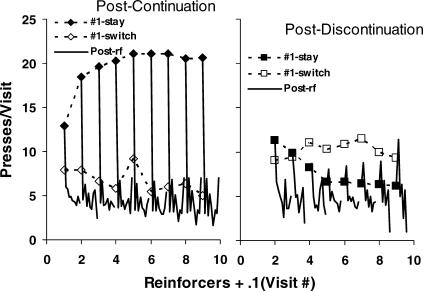
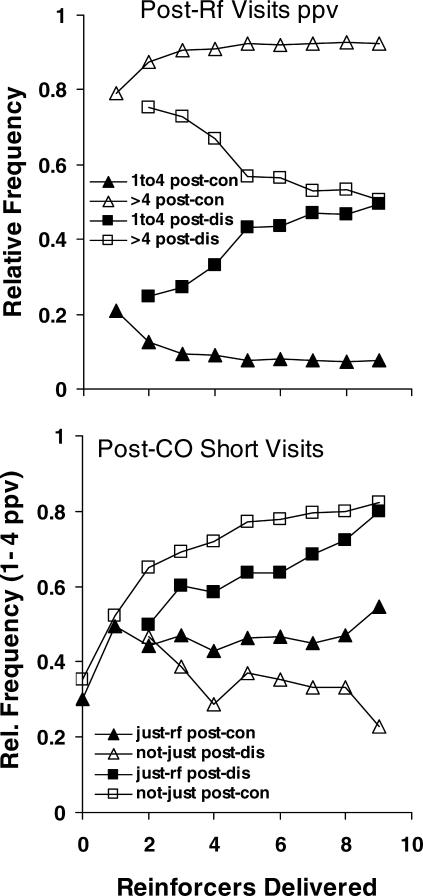
The generality of the molar view of behavior was extended to the study of choice with rats, showing the usefulness of studying order at various levels of extendedness. Rats' presses on two levers produced food according to concurrent variable-interval variable-interval schedules. Seven different reinforcer ratios were arranged within each session, without cues identifying them, and separated by blackouts. To alternate between levers, rats pressed on a third changeover lever. Choice changed rapidly with changes in component reinforcer ratio, and more presses occurred on the lever with the higher reinforcer rate. With continuing reinforcers, choice shifted progressively in the direction of the reinforced lever, but shifted more slowly with each new reinforcer. Sensitivity to reinforcer ratio, as estimated by the generalized matching law, reached an average of 0.9 and exceeded that documented in previous studies with pigeons. Visits to the more-reinforced lever preceded by a reinforcer from that lever increased in duration, while all visits to the less-reinforced lever decreased in duration. Thus, the rats' performances moved faster toward fix and sample than did pigeons' performances in previous studies. Analysis of the effects of sequences of reinforcer sources indicated that sequences of five to seven reinforcers might have sufficed for studying local effects of reinforcers with rats. This study supports the idea that reinforcer sequences control choice between reinforcers, pulses in preference, and visits following reinforcers.


Figures

Fig A1
Fig A1. Depth analyses for the individual rats.
Details as in Figure 5.
Fig A2
Fig A2. Postcontinuation and postdiscontinuation visits analyzed individually for Rats 30 and 31.
All details as in Figure 9.
Fig A3
Fig A3. Postcontinuation and postdiscontinuation visits analyzed individually for Rats 32 and 33.
All details as in Figure 9.
Fig A4
Fig A4. Postcontinuation and postdiscontinuation visits analyzed individually for Rats 34 and 35.
All details as in Figure 9.
Fig A5
Fig A5. Postcontinuation and postdiscontinuation visits analyzed individually for Rats 36 and 37.
All details as in Figure 9.
Fig 1
Fig 1. Log (base 2) of behavior ratio as a function of successive reinforcers delivered in a component.
The multiple panels are organized according to the components. Different lines represent the individual rats.
Fig 2
Fig 2. Sensitivity to reinforcer ratio (s in Equation 1) as a function of the number of reinforcers delivered in a component, calculated using arranged reinforcer ratios.
The light lines represent data for the individual rats, and the heavy solid line with diamonds indicates the group average. The heavy broken line with squares and the heavy solid line with triangles show the slopes from multiple regression analysis using current reinforcer ratio and previous behavior ratio as the predictor variables, respectively. Points plotted at zero on the x-axis indicate performance before any reinforcer was delivered.
Fig 3
Fig 3. Log (base 2) of interreinforcer behavior ratio as a function of the source sequence of reinforcers for the first four reinforcers within components.
P: first-reinforced lever; N: not-first-reinforced lever. Filled symbols and solid lines represent P reinforcers, and unfilled symbols and broken lines indicate N reinforcers. Points plotted at zero on the x-axis represent data before any reinforcer was delivered.
Fig 4
Fig 4. For group data and the first four reinforcers, length of the first visit following a reinforcer (presses per visit) on the lever that produced the first reinforcer of a component (first-reinforced alternative: P; left panel) and length of visits following a reinforcer on the not-first-reinforced lever (N; right panel) as a function of reinforcer-source sequence.
The unfilled symbols indicate visits in which a switch followed a reinforcer. Points plotted at zero on the x-axis represent data before any reinforcers were delivered.
Fig 5
Fig 5. The effect, averaged across rats, of the first reinforcer in sequences up to eight reinforcers on three interreinforcer measures following the sequence: log2 behavior ratio (diamonds); log2 first postreinforcer visit length (squares); log2 average postchangeover visit length at the not-first-reinforced lever of the component (triangles).
The effect was calculated by taking the difference in a measure following two sequences identical except for the first reinforcer (first-reinforced lever in a component vs. not-first-reinforced) and averaging across all sequences of the same length. Error bars represent standard deviations across rats.
Fig 6
Fig 6. Log interreinforcer behavior ratio within components as a function of number of continuing reinforcers from the same lever (filled symbols and solid lines) and following a reinforcer from the other lever (a discontinuation; unfilled symbols and broken lines).
Points plotted at zero on the x-axis represent preference before any reinforcers were delivered. See text for more details.
Fig 7
Fig 7. Visit length (presses per visit) following a series of continuing reinforcers or following a series of continuing reinforcers ending with a discontinuation.
Group data are shown for the first nine reinforcers delivered. Filled symbols represent visits following a reinforcer from the first-reinforced (P) lever. Unfilled symbols indicate visits following a discontinuation or a series of continuing reinforcers from the not-first-reinforced lever. Left: first visit following a reinforcer (i.e., postreinforcer visits). Right: visits beginning and ending with a switch (postchangeover visits). Points plotted at zero on the x-axis show average visit length prior to the first reinforcer in a component. Note the different scales on the y-axes.
Fig 8
Fig 8. Probability that responding stayed at the just-reinforced lever following a series of continuing reinforcers from the first-reinforced (P) lever (filled diamonds), and following a series of continuing reinforcers from the first-reinforced lever ending with a discontinuation from the not-first-reinforced (N) lever (unfilled diamonds).
The figure shows group data. Unfilled squares indicate the probability of staying following a series of continuing reinforcers from the N lever ending with a discontinuation from the P lever.
Fig 9
Fig 9. Visit length (presses per visit) following a series of continuing reinforcers (left graph) or following a series of continuing reinforcers ending with a discontinuation (right graph) for the first nine reinforcers in a component (group data).
Filled symbols show the first postreinforcer visit to the just-reinforced lever (#1 stay). Unfilled symbols show the first postreinforcer visit to the not-just-reinforced lever (#1 switch). The solid lines without symbols represent the subsequent nine postreinforcer visits (i.e., postchangeover visits) in order, plotted in tenths along the x-axis. Sample size was allowed to vary down to one visit.
Fig 10
Fig 10. Relative frequency of visits less than or equal to four presses and of visits longer than four presses for the first nine reinforcers in a component.
Top: First visit to the just-reinforced lever following a series of continuing reinforcers from the same lever (triangles) or following a series of continuing reinforcers ending with a discontinuation (squares). Bottom: Interreinforcer visits beginning with a changeover following a series of continuing reinforcers from the same lever or following a discontinuation. Filled symbols represent visits to the just-reinforced lever. Unfilled symbols represent visits to the not-just-reinforced lever. Triangles represent visits to the rich lever, and the squares represent visits to the lean lever. See text for more details.

Similar articles

Cited by

References

    1. Aparicio C.F. Overmatching in rats: The barrier choice paradigm. Journal of the Experimental Analysis of Behavior. 2001;75:93–106. - PMC - PubMed
    1. Aparicio C.F, Baum W.M. Comparing locomotion with lever-press travel in an operant simulation of foraging. Journal of the Experimental Analysis of Behavior. 1997;68:177–192. - PMC - PubMed
    1. Aparicio C.F, Cabrera F. Choice with multiple alternatives: The barrier choice paradigm. Mexican Journal of Behavior Analysis. 2001;27:97–118.
    1. Bailey J.T, Mazur J.E. Choice behavior in transition: Development of preference for the higher probability of reinforcement. Journal of the Experimental Analysis of Behavior. 1990;53:409–422. - PMC - PubMed
    1. Baum W.M. On two types of deviation from the matching law: Bias and undermatching. Journal of the Experimental Analysis of Behavior. 1974;22:231–242. - PMC - PubMed

Publication types

LinkOut - more resources