. 2006 Aug 12:7:206.
doi: 10.1186/1471-2164-7-206.

A high-density consensus map of barley linking DArT markers to SSR, RFLP and STS loci and agricultural traits

Affiliations

A high-density consensus map of barley linking DArT markers to SSR, RFLP and STS loci and agricultural traits

Peter Wenzl et al. BMC Genomics. .

Abstract

Background: Molecular marker technologies are undergoing a transition from largely serial assays measuring DNA fragment sizes to hybridization-based technologies with high multiplexing levels. Diversity Arrays Technology (DArT) is a hybridization-based technology that is increasingly being adopted by barley researchers. There is a need to integrate the information generated by DArT with previous data produced with gel-based marker technologies. The goal of this study was to build a high-density consensus linkage map from the combined datasets of ten populations, most of which were simultaneously typed with DArT and Simple Sequence Repeat (SSR), Restriction Enzyme Fragment Polymorphism (RFLP) and/or Sequence Tagged Site (STS) markers.

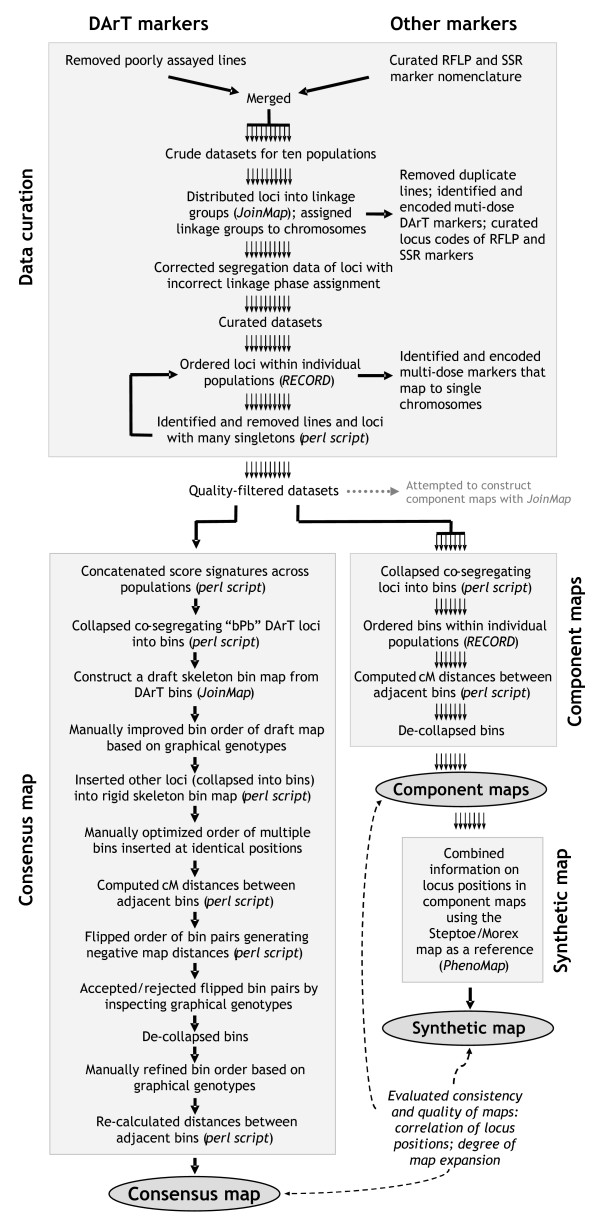
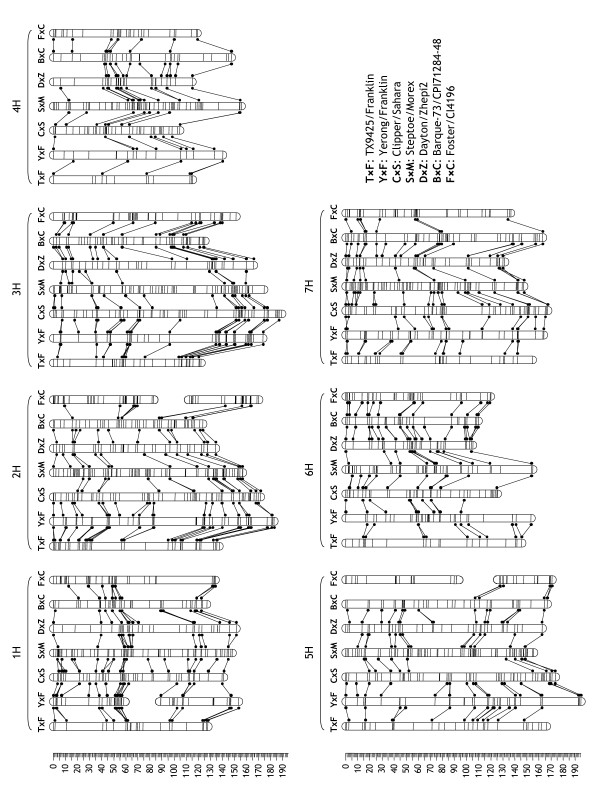
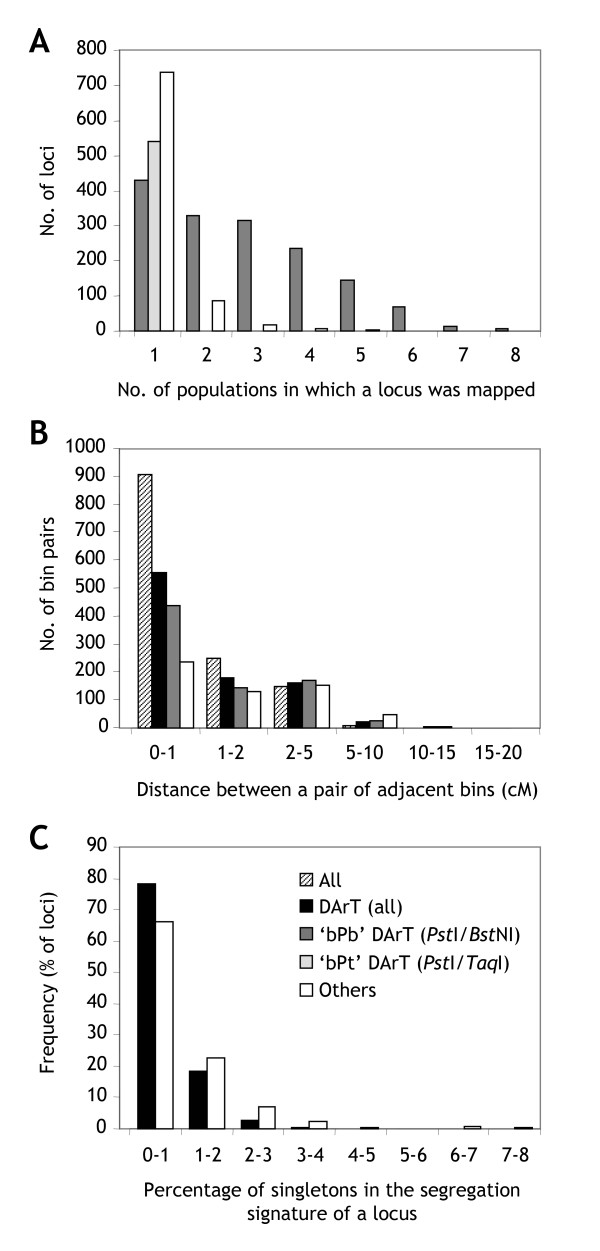
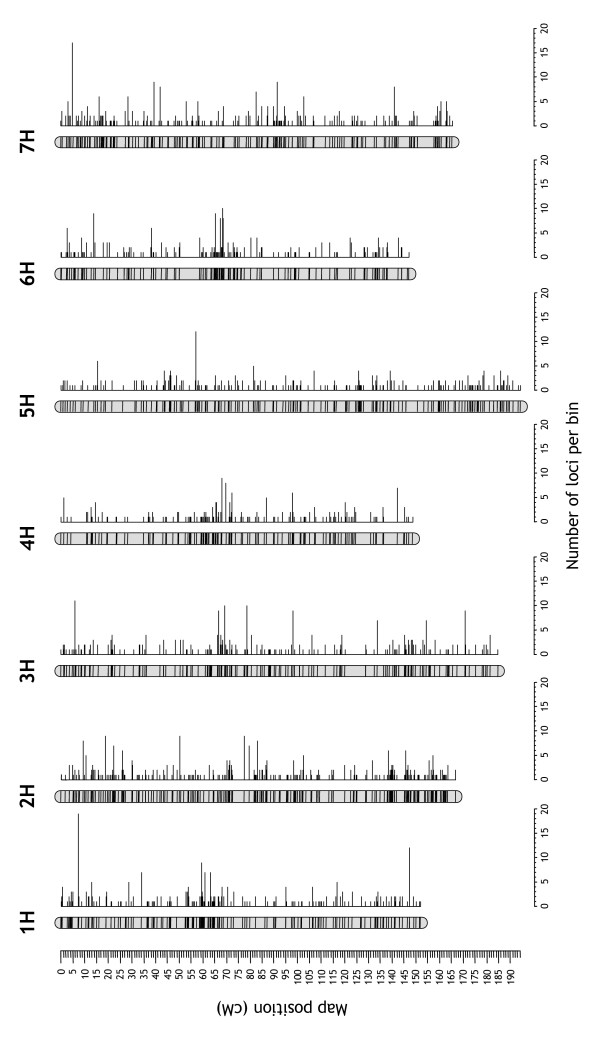
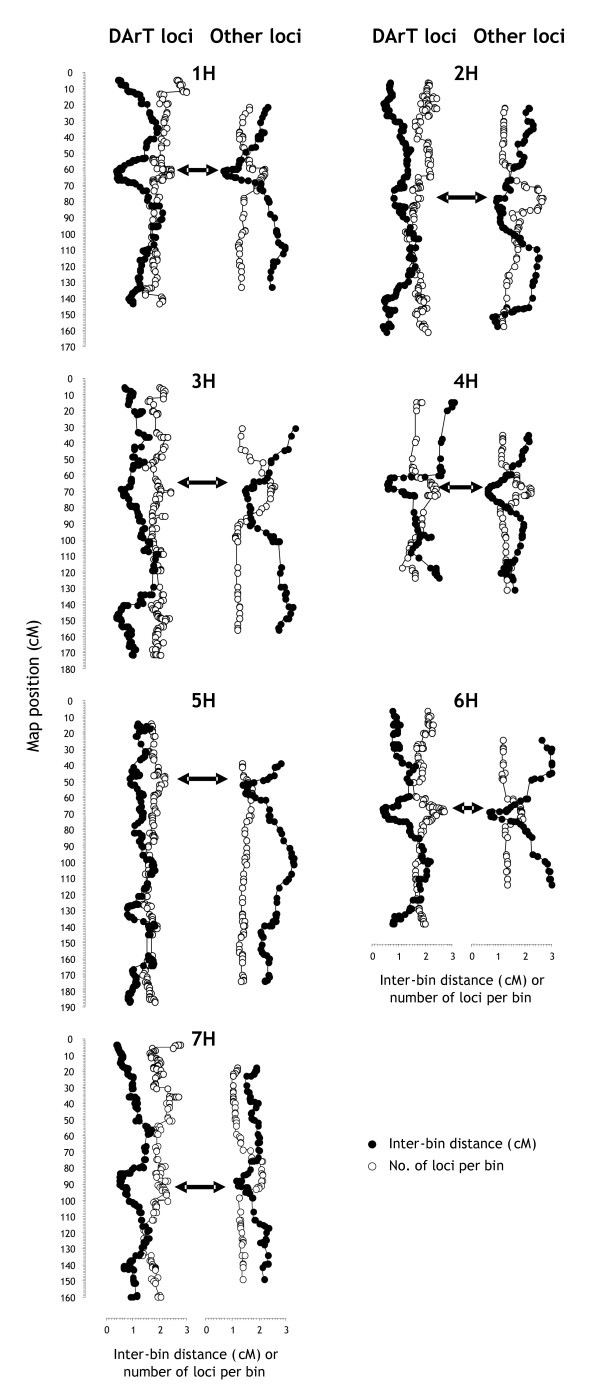
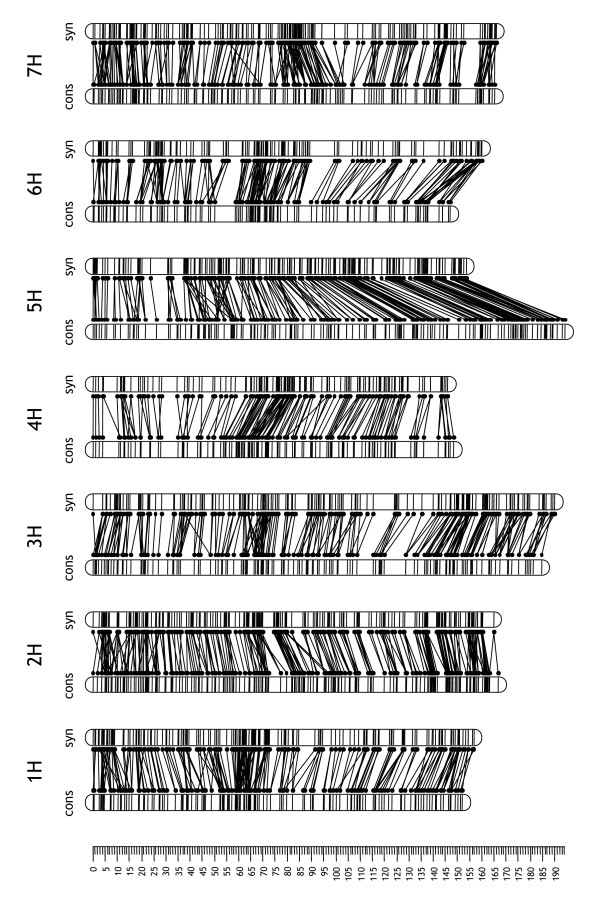
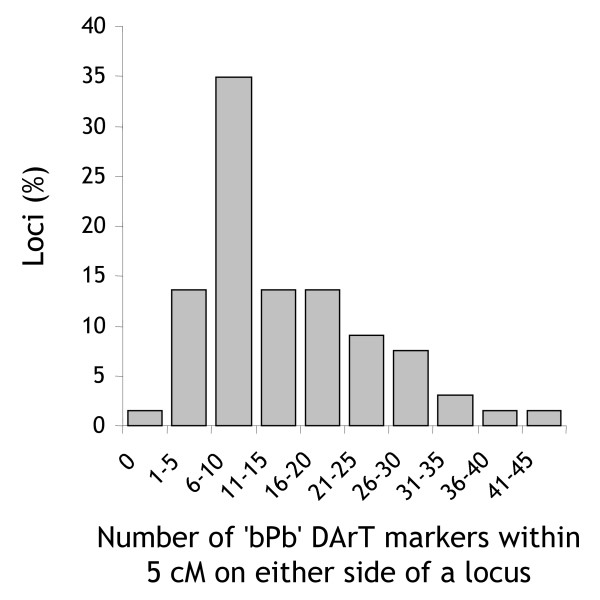
Results: The consensus map, built using a combination of JoinMap 3.0 software and several purpose-built perl scripts, comprised 2,935 loci (2,085 DArT, 850 other loci) and spanned 1,161 cM. It contained a total of 1,629 'bins' (unique loci), with an average inter-bin distance of 0.7 +/- 1.0 cM (median = 0.3 cM). More than 98% of the map could be covered with a single DArT assay. The arrangement of loci was very similar to, and almost as optimal as, the arrangement of loci in component maps built for individual populations. The locus order of a synthetic map derived from merging the component maps without considering the segregation data was only slightly inferior. The distribution of loci along chromosomes indicated centromeric suppression of recombination in all chromosomes except 5H. DArT markers appeared to have a moderate tendency toward hypomethylated, gene-rich regions in distal chromosome areas. On the average, 14 +/- 9 DArT loci were identified within 5 cM on either side of SSR, RFLP or STS loci previously identified as linked to agricultural traits.

Conclusion: Our barley consensus map provides a framework for transferring genetic information between different marker systems and for deploying DArT markers in molecular breeding schemes. The study also highlights the need for improved software for building consensus maps from high-density segregation data of multiple populations.


Figures

Figure 1
Figure 1
Schematic outline of map-building strategies used in this study. Pilot maps were built for each of the ten populations separately to flip the phase of loci assigned to the wrong phase, to identify multi-locus markers, and to remove loci and lines with excessive numbers of singletons (apparent double crossovers). The quality-filtered datasets were then used to build seven 'component' maps for individual populations with sufficient numbers of lines and loci. The integrated dataset of all ten populations was used to build a consensus map. The quality of the locus order of the consensus map was evaluated by comparison against the order of loci in the component maps and a 'synthetic map' derived from the component maps.
Figure 2
Figure 2
Colinearity of locus order in component maps. Loci in component maps are displayed schematically by horizontal lines across the bars representing chromosomes. Loci that are common between adjacent pairs of populations are depicted by dots and connected by lines [30].
Figure 3
Figure 3
Consensus map features by marker type. (A) Frequency with which individual markers were mapped in the ten populations. The 'bPb' DArT markers from the PstI/BstNI representation (assayed across all populations) and the 'bPt' markers from the PstI(TaqI) representation (only assayed in the Steptoe/Morex population) were separately compared against other markers (SSR, RFLP, STS). (B) Map resolution. Loci from each of four datasets (all markers, all DArT markers, 'bPb' DArT markers, other markers) were collapsed into bins by comparing their segregation signatures across populations. The bins were arranged according to the consensus map order, and the distances between pairs of adjacent bins were calculated. (C) Map quality. Loci from two datasets (all DArT markers, other markers) were jointly collapsed into bins by comparing their segregation signatures across populations. The bins were arranged in the order of the consensus map, and the number of singletons for the locus with the highest call rate within each bin was counted and expressed as a percentage of the number of genotype calls.
Figure 4
Figure 4
Schematic view of the consensus map. The 2,935 loci of the consensus map were collapsed into 1,629 bins by comparing their segregation signatures across populations. Each bin is represented by a horizontal line across a chromosome. The lengths of the horizontal lines to the right of each chromosome depict the number of co-segregating markers within each bin.
Figure 5
Figure 5
Visualization of marker-dense regions in barleychromosomes. DArT and non-DArT loci were separately collapsed into bins by comparing their segregation signatures across populations. The bins of each dataset were arranged in the order of the consensus map. The number of loci per bin and the distance between adjacent bins (inter-bin distance) were then averaged across a 19-bin sliding window that was moved across each chromosome. Approximate centromere positions are indicated by horizontal two-sided arrows.
Figure 6
Figure 6
Alignment of the consensus map with a syntheticmap. Comparison of locus positions between the JoinMap/perl consensus map ('cons') and a synthetic map built with PhenoMap software using the Steptoe/Morex map as a reference map ('syn'). The position of each locus in the two maps is highlighted by a pair of dots connected by a line [30].
Figure 7
Figure 7
Number of 'bPb' DArT loci linked to loci affecting agricultural traits. Histogram of the number of 'bPb' DArT loci within 5 cM on either side of 66 loci affecting agricultural traits. The positions of these loci were defined by SSR, RFLP or STS markers that were incorporated into the consensus map and had previously been identified to be closely linked to agricultural traits (Additional Files 11, 12).

Similar articles

Cited by

References

    1. Zohary D, Hopf M. Domestication of plants in the old world. Oxford, United Kingdom: Clarendon Press; 1988.
    1. Vivar HE, McNab A. Proceedings of an International Symposium: 13–14 March 2000. Ciudad Obregon, Mexico. CIMMYT; 2003. Breeding barley in the new millemium.
    1. Langridge P, Barr AR. Preface. Austr J Agric Res. 2003;54:i–iv. doi: 10.1071/ARv54n12_PR. - DOI
    1. Hayes PM, Castro A, Marquez-Cedillo L, Corey A, Henson C, Jones B, Kling J, Mather D, Matus I, Rossi C, Sato K. A summary of published barley QTL reports http://www.barleyworld.org/northamericanbarley/qtlsummary.php
    1. Koebner RMD, Powell W, Donini P. Contributions of DNA molecular marker technologies to the genetics and breeding of what and barley. Plant Breed Rev. 2001;21:181–220.

Publication types

MeSH terms

Substances

LinkOut - more resources