. 2006 Oct 25;354(2):299-315.
doi: 10.1016/j.virol.2006.06.036. Epub 2006 Aug 9.

A DNA prime-oral Listeria boost vaccine in rhesus macaques induces a SIV-specific CD8 T cell mucosal response characterized by high levels of alpha4beta7 integrin and an effector memory phenotype

Affiliations

A DNA prime-oral Listeria boost vaccine in rhesus macaques induces a SIV-specific CD8 T cell mucosal response characterized by high levels of alpha4beta7 integrin and an effector memory phenotype

Paul Neeson et al. Virology. .

Abstract

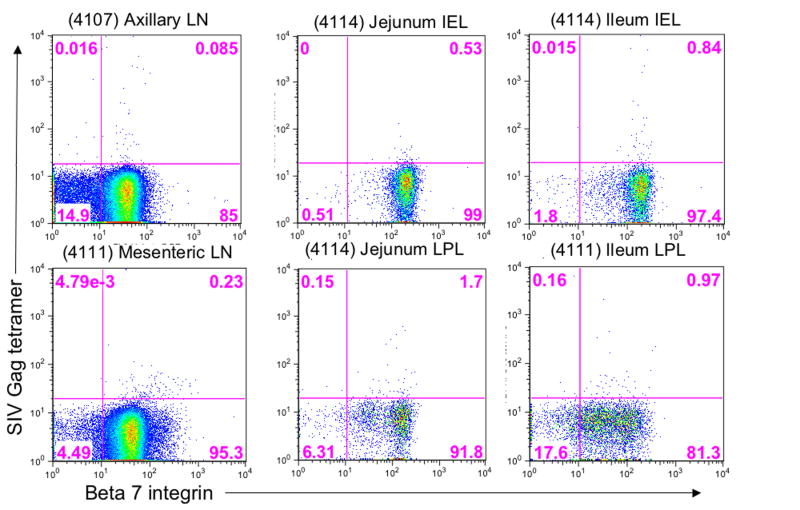
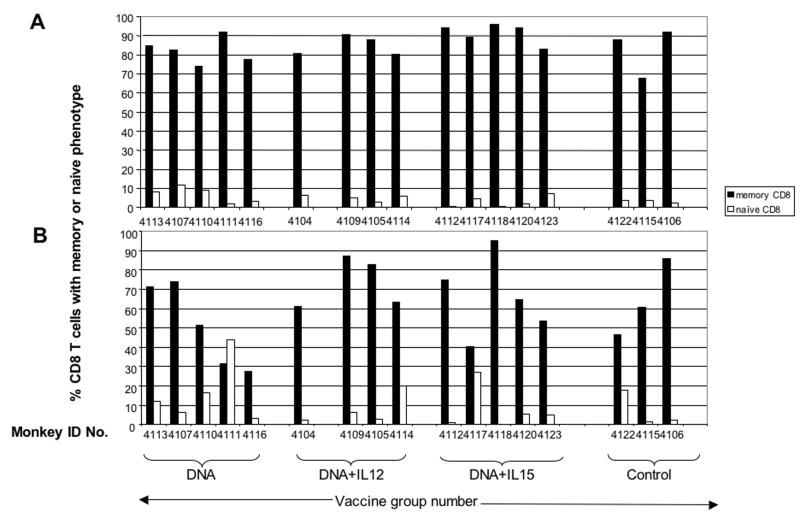
In this study in Rhesus macaques, we tested whether IL-12 or IL-15 in a DNA prime-oral Listeria boost amplifies the SIV-Gag-specific CD8 mucosal response. SIV-specific CD8 T cells were demonstrated in the peripheral blood (PB) in all test vaccine groups, but not the control group. SIV-Gag-specific CD8 T cells in the PB expressed alpha4beta7 integrin, the gut-homing receptor; a minor subset co-express alphaEbeta7 integrin. SIV-Gag-specific CD8 T cells were also detected in the gut tissue, intraepithelial (IEL) and lamina propria lymphocytes (LPL) of the duodenum and ileum. These cells were characterized by high levels of beta7 integrin expression and a predominance of the effector memory phenotype. Neither Il-12 nor IL-15 amplified the frequency of SIV-specific CD8 T cells in the gut. Thus, the DNA prime-oral Listeria boost strategy induced a mucosal SIV-Gag-specific CD8 T cell response characterized by expression of the alpha4beta7 integrin gut-homing receptor.


Figures

Figure 1
Figure 1. DNA prime Listeria boost immunization induced SIV gag-specific CD8 T cells in the peripheral blood and axillary lymph node but not the mesenteric lymph node
SIV gag-specific CD8 T cells were detected by ELISPOT for IFN-gamma secretion in response to SIV-Gag and SIV Env overlapping peptides (as per methods). The ELISPOT assay was performed on (A) PBMC’s harvested during DNA and Listeria immunizations, samples were collected 14 days after each immunization except 3rd LmD7, which was collected 7 days after the 3rd Listeria immunization (B) PBMCs harvested days 7 and 14 post-final Listeria immunization, and (C) PBMCs, axillary and mesenteric lymph nodes harvested day 14 post-final Listeria immunization. Samples are positive when they have > 50 SFC per million PBMCs. Samples marked by an asterisk (*) have >50% reduction in SFC/million PBMCs after CD8 depletion of the PBMCs. In Figure 1A the ELISPOT data has been plotted as the mean ± standard error for Gag (Ai) and Env (Aii) responses for each immunization group over the timecourse of the DNA prime-Listeria boost; whereas in Figure 1B–C the individual data for each monkey has been plotted on samples collected day 14 after the last Listeria boost.
Figure 2
Figure 2. DNA prime-Listeria boost vaccine induces SIV-gag specific CD8 T cells that are present in the periphery
Dot plots from representative samples demonstrating the binding of SIV-Gag tetramer and surface expression of beta 7 integrin on CD8 T cells from PB. CD8 T cells were first selected based on a lymphocyte scatter gate followed by dual expression of CD3 and CD8.
Figure 3
Figure 3. DNA prime-Listeria boost vaccine induces SIV-gag specific CD8 T cells that are present in the gut and lymph nodes
Dot plots from representative samples (monkey no. in brackets) demonstrating the binding of SIV-Gag tetramer and surface expression of beta 7 integrin on CD8 T cells from gut tissue (jejunum and ileum), mesenteric and axillary lymph nodes. CD8 T cells were selected based on a lymphocyte scatter gate and dual expression of CD3 and CD8.
Figure 4
Figure 4. Beta 7 integrin expression on SIV Gag-specific CD8 T cells in the peripheral blood does not differ between different DNA prime-Listeria boost vaccine groups
Results show the frequency of SIV Gag tetramer positive CD8 T cells that co-express beta 7 integrin (black) or lack beta 7 integrin (white). Data is presented on SIV Gag tetramer (A01 or A02) positive cells from day 7 (D7) or day 14 (D14) post-last Listeria boost. Also indicated are the monkey number and the vaccine group to which individual monkeys belong.
Figure 5
Figure 5. Beta 7 integrin expression on CD8 T cells differs between the peripheral blood, lymph nodes and the gut tissue
Dot plots from representative samples depict the relative expression of beta 7 integrin on CD8 T cells isolated from peripheral blood(A), mesenteric or axillary lymph nodes and gut tissue (B). T cells were selected based on expression of CD3 and a lymphocyte scatter gate.
Figure 6
Figure 6. CD8 T cells expressing α4β7 integrin increase in the peripheral blood of some immunized monkeys from day 7 to day 14 post-Listeria boost
The percentage of CD8 T cells expressing beta 7 integrin was monitored in the peripheral blood on days 7 and 14 after the final Listeria boost immunization. This graph represents the frequency of CD8 T cells expressing beta 7 at high (A) or moderate (B) levels. CD8 T cells were selected based on co-expression of CD3 and CD8 and a lymphocyte scatter gate. Arrows indicate monkeys with CD8 T cells positive for SIV Gag tetramer binding and/or IFN-gamma ELISPOT. The integrin alpha chain co-expressed with the beta 7 subunit was demonstrated in (C). Representative dot plots in (C) depicting the alpha chain expression on CD8 T cells that are beta 7 integrin positive (a), beta 7 moderate (b) and beta 7 high (c)
Figure 7
Figure 7. High beta 7 integrin expressing CD8 T cells are prevalent at gut effector sites
The percentage of CD8 T cells expressing beta 7 integrin at high, moderate or low levels was monitored in the ileum, intraepithelial cells (A) and lamina propria lymphocytes (B) day 14 after the final Listeria boost immunization. CD8 T cells were selected based on co-expression of CD3 and CD8 and a lymphocyte scatter gate, beta 7 expression on CD8 T cells was divided into either low, moderate or high levels (as per Figure 5). Arrows indicate monkeys with elevated numbers of CD8 T cells that express beta 7 at high levels and are positive for SIV Gag tetramer and/or IFN-gamma ELISPOT.
Figure 8
Figure 8. Gut tissue, lymph nodes and peripheral blood contain different proportions of naïve and memory CD8 T cells
Dot plots from representative samples showing (A) a peripheral blood sample with the gating procedure to define CD8 T cells and then CD95 versus CD28 expression to define the naïve (N), central (C) and effector (EM) memory cell. Dot plots in (B) show representative distribution of naïve, central and effector memory cells in lymph nodes and gut tissue.
Figure 9
Figure 9. Effector memory and naïve CD8 T cells alter in the peripheral blood after immunization
Effector memory and naïve CD8 T cells were assessed in the peripheral blood on days 7 and 14 post-listeria boost. Relative expression of CD95 and CD28 on CD8 T cells was used to define the effector memory (A) and naïve (B) cells, as per Figure 9. CD8 T cells were defined by scatter gates and co-expression of CD3 and CD8.
Suppl Figure 1
Suppl Figure 1. CD8 T cells migrating to the lymph nodes express beta 7 integrin
The frequency of CD8 T cells expressing beta 7 was determined (as per Figure 5) on mesenteric lymph node (A) or axillary lymph node (B). Data points with arrows indicate samples where CD8 T cells had elevated tetramer binding and/or were ELISPOT positive.
Suppl Figure 2
Suppl Figure 2. Naïve cells are the major CD8 T cell population in lymph nodes
The following are representative graphs of the relative distribution of effector memory and naïve CD8 T cells in the lymph nodes. The frequency of lymph node memory and naïve Cd8 T cells are shown for the axillary (A) and mesentric (B) lymph node. Relative expression of CD95 and CD28 on CD8 T cells was used to define the effector memory and naïve cells, as per Figure 9.
Suppl Figure 3
Suppl Figure 3. Effector memory CD8 T cells predominate at gut effector sites
Gut tissue memory and naïve CD8 T cell frequency are shown for the ileum – IEL fraction (A) and LPL fraction (B). Relative expression of CD95 and CD28 on CD8 T cells was used to define the effector memory and naïve cells, as per Figure 9.

Similar articles

Cited by

References

    1. Allen TM, Sidney J, del Guercio MF, Glickman RL, Lensmeyer GL, Wiebe DA, DeMars R, Pauza CD, Johnson RP, Sette A, Watkins DI. Characterization of the peptide binding motif of a rhesus MHC class I molecule (Mamu-A*01) that binds an immunodominant CTL epitope from simian immunodeficiency virus. J Immunol. 1998;160(12):6062–71. - PubMed
    1. Andrew DP, Rott LS, Kilshaw PJ, Butcher EC. Distribution of alpha 4 beta 7 and alpha E beta 7 integrins on thymocytes, intestinal epithelial lymphocytes and peripheral lymphocytes. Eur J Immunol. 1996;26(4):897–905. - PubMed
    1. Baig J, Levy DB, McKay PF, Schmitz JE, Santra S, Subbramanian RA, Kuroda MJ, Lifton MA, Gorgone DA, Wyatt LS, Moss B, Huang Y, Chakrabarti BK, Xu L, Kong WP, Yang ZY, Mascola JR, Nabel GJ, Carville A, Lackner AA, Veazey RS, Letvin NL. Elicitation of simian immunodeficiency virus-specific cytotoxic T lymphocytes in mucosal compartments of rhesus monkeys by systemic vaccination. J Virol. 2002;76(22):11484–90. - PMC - PubMed
    1. Betts MR, Exley B, Price DA, Bansal A, Camacho ZT, Teaberry V, West SM, Ambrozak DR, Tomaras G, Roederer M, Kilby JM, Tartaglia J, Belshe R, Gao F, Douek DC, Weinhold KJ, Koup RA, Goepfert P, Ferrari G. Characterization of functional and phenotypic changes in anti-Gag vaccine-induced T cell responses and their role in protection after HIV-1 infection. Proc Natl Acad Sci U S A. 2005;102(12):4512–7. - PMC - PubMed
    1. Bishop DK, Hinrichs DJ. Adoptive transfer of immunity to Listeria monocytogenes. The influence of in vitro stimulation on lymphocyte subset requirements. J Immunol. 1987;139(6):2005–9. - PubMed

Publication types

MeSH terms