Comparative Study
. 2006 Dec;80(6):1298-307.
doi: 10.1189/jlb.0406249. Epub 2006 Aug 11.

Biochemical and functional characterization of three activated macrophage populations

Affiliations
Comparative Study

Biochemical and functional characterization of three activated macrophage populations

Justin P Edwards et al. J Leukoc Biol. 2006 Dec.

Abstract

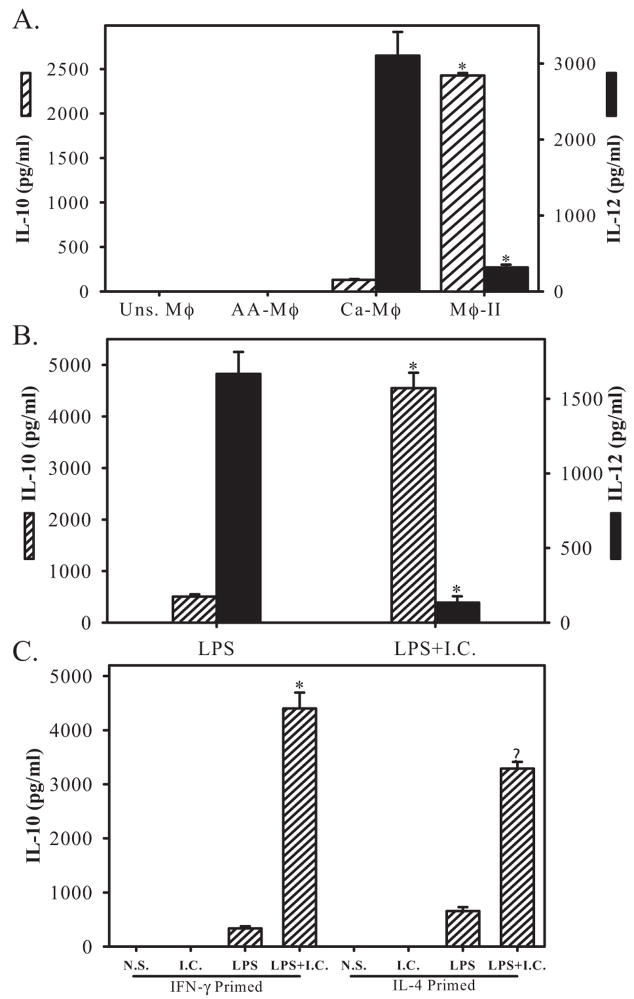
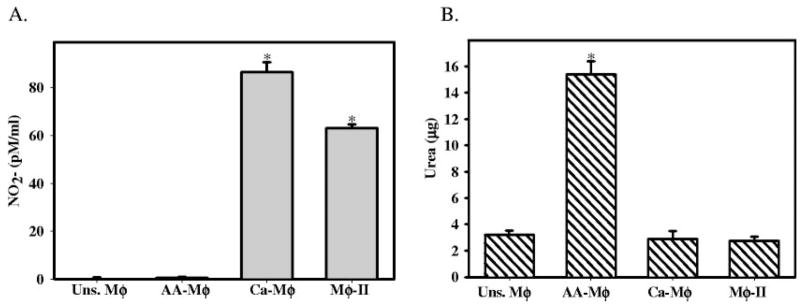
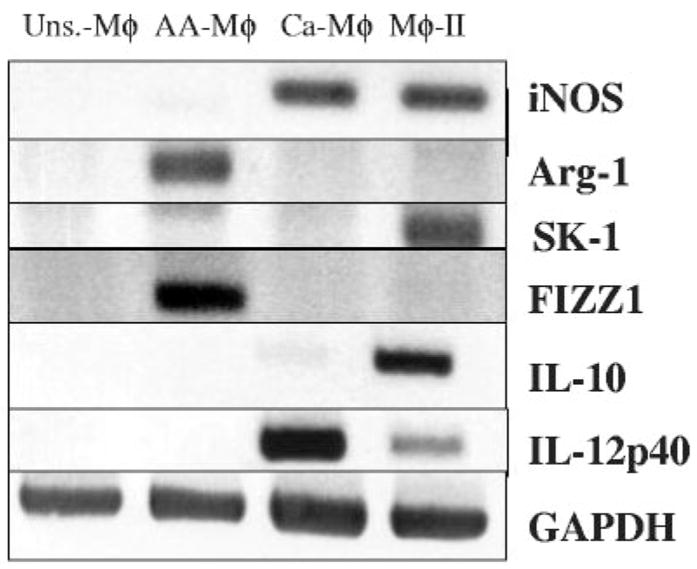
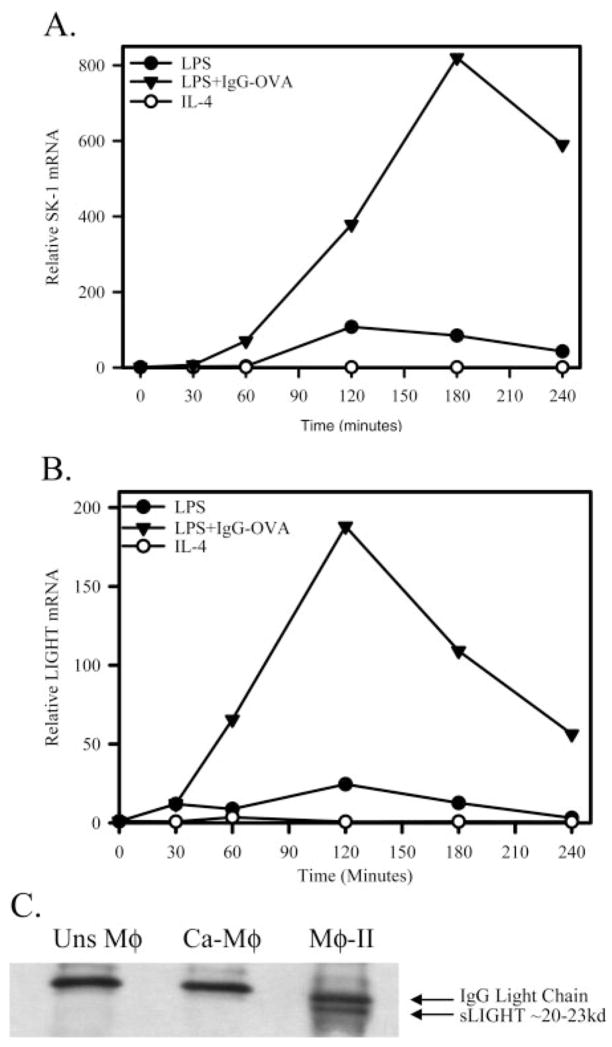
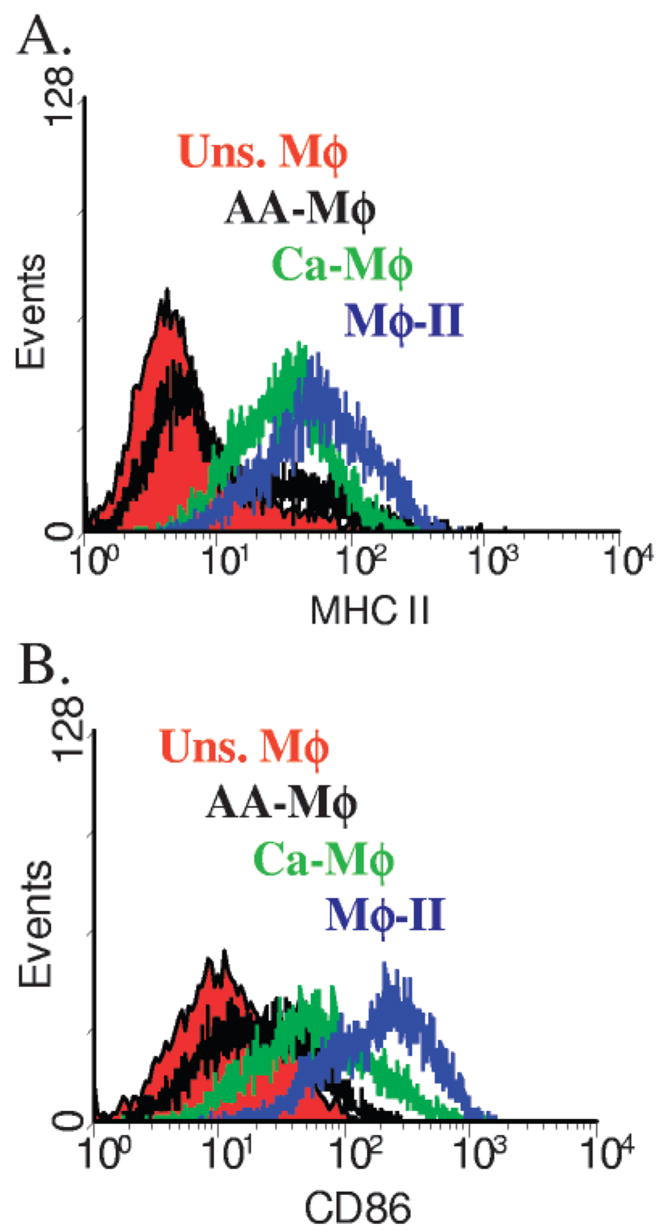
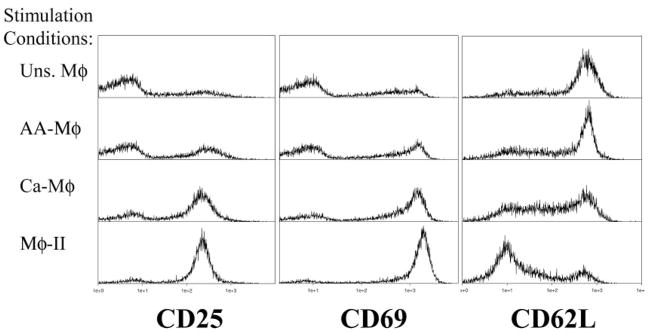
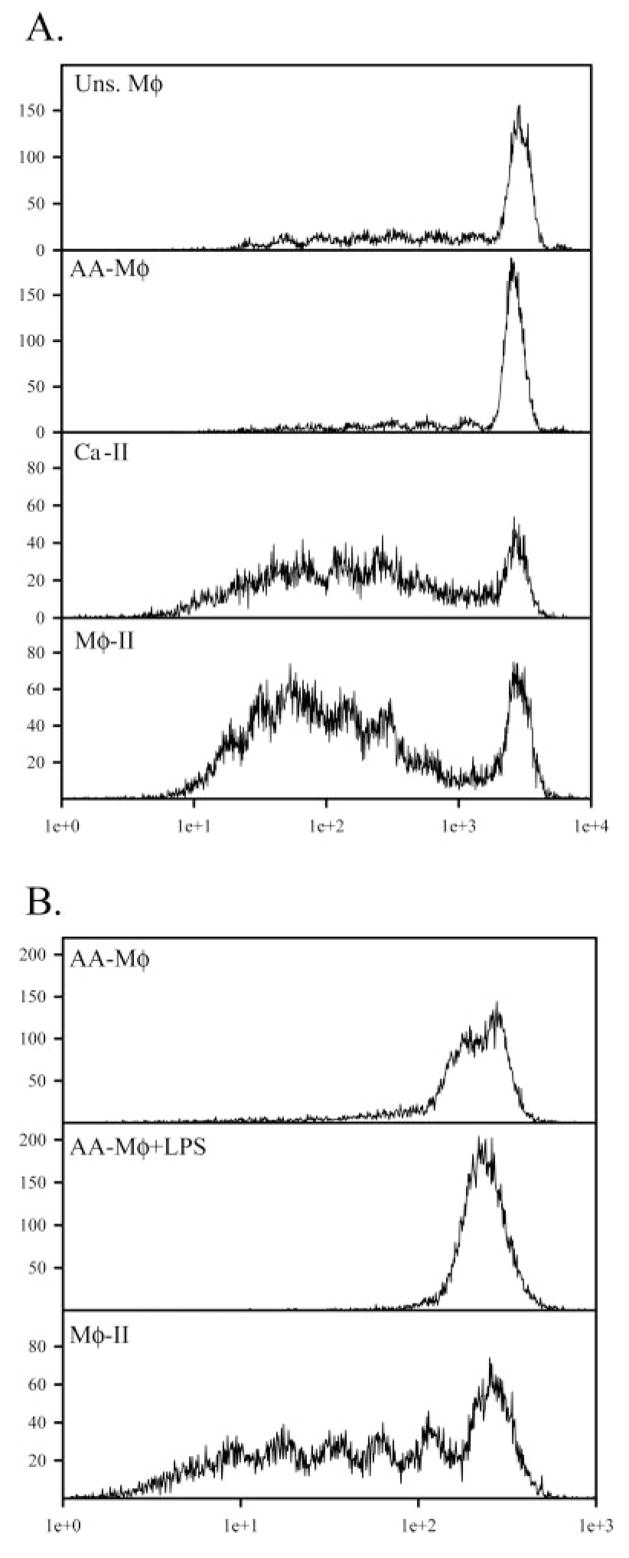
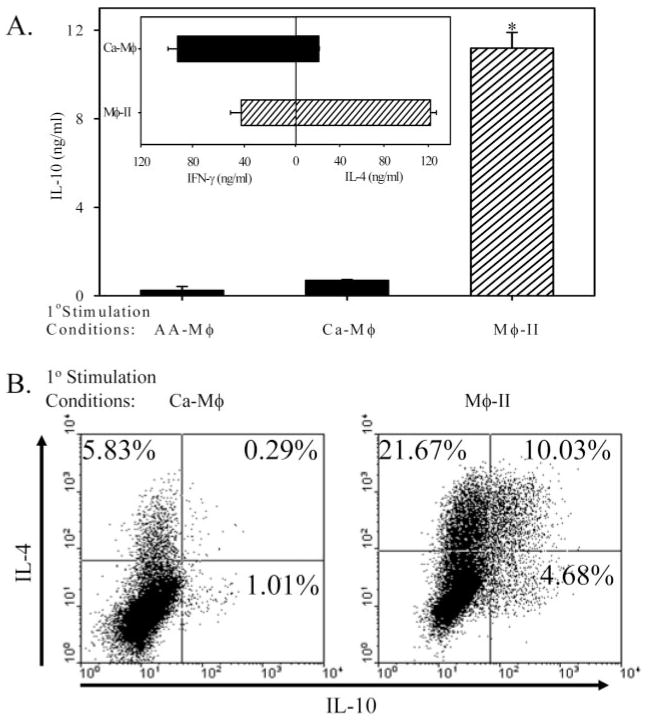
We generated three populations of macrophages (Mphi) in vitro and characterized each. Classically activated Mphi (Ca-Mphi) were primed with IFN-gamma and stimulated with LPS. Type II-activated Mphi (Mphi-II) were similarly primed but stimulated with LPS plus immune complexes. Alternatively activated Mphi (AA-Mphi) were primed overnight with IL-4. Here, we present a side-by-side comparison of the three cell types. We focus primarily on differences between Mphi-II and AA-Mphi, as both have been classified as M2 Mphi, distinct from Ca-Mphi. We show that Mphi-II more closely resemble Ca-Mphi than they are to AA-Mphi. Mphi-II and Ca-Mphi, but not AA-Mphi, produce high levels of NO and have low arginase activity. AA-Mphi express FIZZ1, whereas neither Mphi-II nor Ca-Mphi do. Mphi-II and Ca-Mphi express relatively high levels of CD86, whereas AA-Mphi are virtually devoid of this costimulatory molecule. Ca-Mphi and Mphi-II are efficient APC, whereas AA-Mphi fail to stimulate efficient T cell proliferation. The differences between Ca-Mphi and Mphi-II are more subtle. Ca-Mphi produce IL-12 and give rise to Th1 cells, whereas Mphi-II produce high levels of IL-10 and thus, give rise to Th2 cells secreting IL-4 and IL-10. Mphi-II express two markers that may be used to identify them in tissue. These are sphingosine kinase-1 and LIGHT (TNF superfamily 14). Thus, Ca-Mphi, Mphi-II, and AA-Mphi represent three populations of cells with different biological functions.


Figures

Fig. 1
Fig. 1
Cytokine profiles of activated Mφ. (A) IL-10 (hatched bars, left axis) and IL-12 (solid bars, right axis) were measured by ELISA 16 h after Mφ activation. AA-Mφ were prepared by treating Mφ overnight with IL-4 (10 U/ml). Ca-Mφ and Mφ-II were prepared by treated Mφ with IFN-γ (100 U/ml) overnight and then stimulating with LPS or LPS + IC, respectively. (B) IL-10 (hatched bars) and IL-12 (solid bars) levels in supernatants following a 16-h stimulation of cells with LPS or LPS + IC. These cells were not primed with IFN-γ. (C) IL-10 levels in Mφ primed overnight with IFN-γ or IL-4 and then left unstimulated (Uns.) or stimulated with IC, LPS, or LPS + IC. Figures are representative of at least three independent experiments. N. S., Not stimulated. Error bars indicate ± SD. *, P < 0.001.
Fig. 2
Fig. 2
Activated Mφ exhibit different patterns of arginine metabolism. (A) NO2 accumulation after 24 h of Mφ activation measuring iNOS activity. Equal volumes of cell supernatants were mixed with Greiss reagent for 10 min, and the absorbance at 540λ was measured. A solution of NO2 was used to construct a standard curve. (B) Arginase assay measuring the formation of urea after incubation of lysates from activated Mφ with arginine. Arginase enzyme was activated by heating for 10′ at 55°C. The hydrolysis of arginine to ornithine and urea was conducted by incubating the lysates with L-arginine at 37°C for 60 min. The reaction was stopped, and urea was measured at 550 nm after addition of α-isonitrosopropiophenone followed by heating at 100°C for 30 min. Values were compared with a standard curve of urea concentration. Figures are representative of at least three independent experiments. Error bars indicate ± SD. *, P < 0.00001
Fig. 3
Fig. 3
Activated Mφ have different mRNA expression profiles. RT-PCR was performed to examine the expression of iNOS, Arg-1, SPHK1 (SK-1), FIZZ1, IL-10, and IL-12 (p40) mRNA levels in four different Mφ populations. cDNA from unstimulated Mφ and the three activated Mφ populations were reverse-transcribed from total RNA 4 h after stimulation. GAPDH mRNA was used to normalize loading. Figures are representative of at least three independent experiments.
Fig. 4
Fig. 4
Mφ-II up-regulate SPHK1 and TNFSF14/LIGHT. (A) Relative SPHK1 mRNA as measured by real-time PCR after Mφ activation by LPS (●), LPS + IgG-OVA IC (▲), or IL-4 (○). (B) Relative LIGHT mRNA as measured by real-time PCR after Mφ activation by LPS (●), LPS + IgG-OVA IC (▲), or IL-4 (○). Calculation of fold values was detailed in Materials and Methods. (C) Immunoprecipitation of soluble LIGHT (sLIGHT) from 6 h cell supernatants of unstimulated Mφ, Ca-Mφ, and Mφ-II. Western blot analysis for LIGHT using a rat α-LIGHT mAb, showing the soluble form of LIGHT present as a 20- to 23-kD protein. Figures are representative of at least three independent experiments.
Fig. 5
Fig. 5
Activated Mφ express different levels of MHC Class II and B7 costimulatory molecules. Flow cytometry profiles for (A) MHC Class II and (B) B7.2 (CD86) on activated Mφ 24 h after stimulation. Mφ were primed with IFN-γ and stimulated with LPS (Ca-Mφ) or LPS + IC (Mφ-II), primed with IL-4 (AA-Mφ) or left unstimulated. Mφ were stained with FITC-conjugated α-I-Ad or PE-conjugated α-CD86. Changes in expression are assessed by comparison against unstimulated Mφ. Figures are representative of at least three independent experiments.
Fig. 6
Fig. 6
Activated Mφ drive different levels of T cell activation. DO11.10 T cells were stained after 24 h of coculture with unstimulated (top panels), AA-Mφ (upper-middle panels), Ca-Mφ (lower-middle panels), and Mφ-II (bottom panels) in the presence of antigen. T cells were selected by gating for Thyl.2+ cells and CD25 (left), CD69 (center), and CD62L (right). Figures are representative of at least three independent experiments.
Fig. 7
Fig. 7
Activated Mφ drive different levels of T cell proliferation. (A) Naïve T cells were isolated from total splenocytes from DO11.10, CFSE-stained, and co-cultured in the presence of unstimulated (top panel), AA-Mφ (upper-middle panel), Ca-Mφ (lower-middle panel), or Mφ-II (bottom panel) in the presence of 150 μg/ml OVA. CFSE profiles of Thy1.2+ T cells were measured after 96 h of coculture. (B) AA-Mφ given OVA alone (upper panel) or OVA + LPS (10 ng/ml, center panel). Mφ-II were used as APC as in (A). Figures are representative of at least three independent experiments.
Fig. 8
Fig. 8
Cytokine profiles of T cells after secondary stimulation. T cells were cocultured with AA-Mφ Ca-Mφ, or Mφ-II for 1 week, washed, then restimulated with plate-bound α-CD3 (5 μg/ml). (A) IL-10 from T cells restimulated for 24 h as measured by ELISA. (Inset) T cell cytokine production following primary stimulation with Ca-Mφ (upper) or Mφ-II (lower), as described previously [11]. (B) Intracellular staining for IL-4 and IL-10. T cells were restimulated for 6 h in the presence of GolgiStop (monensin) with plate-bound α-CD3e after biasing and activation by Ca-Mφ (left panel) or Mφ-II (right panel). Cells were fixed/permeablized using the Cytofix/Cytoperm reagent and stained using a PE-conjugated antibody against IL-4 and a FITC-conjugated antibody against IL-10. Quadrants are set using appropriate isotype controls. Figures are representative of at least three independent experiments. Error bars indicate ± SD. *, P < 0.00001.

References

    1. Lang R, Patel D, Morris JJ, Rutschman RL, Murray PJ. Shaping gene expression in activated and resting primary macrophages by IL-10. J Immunol. 2002;169:2253–2263. - PubMed
    1. David JR. Macrophage activation by lymphocyte mediators. Fed Proc. 1975;34:1730–1736. - PubMed
    1. Akira S, Uematsu S, Takeuchi O. Pathogen recognition and innate immunity. Cell. 2006;124:783–801. - PubMed
    1. Oppenheim JJ, Yang D. Alarmins: chemotactic activators of immune responses. Curr Opin Immunol. 2005;17:359–365. - PubMed
    1. Nathan C, Shiloh MU. Reactive oxygen and nitrogen intermediates in the relationship between mammalian hosts and microbial pathogens. Proc Natl Acad Sci USA. 2000;97:8841–8848. - PMC - PubMed

Publication types

MeSH terms