. 2006 Sep;13(9):831-8.
doi: 10.1038/nsmb1132. Epub 2006 Aug 13.

Dynamically driven protein allostery

Affiliations

Dynamically driven protein allostery

Nataliya Popovych et al. Nat Struct Mol Biol. 2006 Sep.

Abstract

Allosteric interactions are typically considered to proceed through a series of discrete changes in bonding interactions that alter the protein conformation. Here we show that allostery can be mediated exclusively by transmitted changes in protein motions. We have characterized the negatively cooperative binding of cAMP to the dimeric catabolite activator protein (CAP) at discrete conformational states. Binding of the first cAMP to one subunit of a CAP dimer has no effect on the conformation of the other subunit. The dynamics of the system, however, are modulated in a distinct way by the sequential ligand binding process, with the first cAMP partially enhancing and the second cAMP completely quenching protein motions. As a result, the second cAMP binding incurs a pronounced conformational entropic penalty that is entirely responsible for the observed cooperativity. The results provide strong support for the existence of purely dynamics-driven allostery.


Conflict of interest statement

Competing Interests Statement: The authors declare that they have no competing financial interests.

Figures

Figure 1
Figure 1
Distinct conformational states of CAPN. 2D 1H-15N HSQC spectra of U-2H-15N-labeled CAPN in the (a) apo, (b) singly liganded complex (cAMP1-CAPN), and (c) doubly liganded complex (cAMP2-CAPN). Spectra were recorded at 30 °C on a 600-MHz NMR instrument. Molecular models were drawn using the structure of cAMP2-CAP (PDB entry 1G6N). cAMP is shown in green sticks.
Figure 2
Figure 2
Effect of the sequential cAMP binding on the structure of CAPN assessed by chemical shift mapping. The chemical shift is a highly sensitive probe of the local electronic environment of the nucleus and, thus, provides very useful information about the chemical structure of the protein. The combined chemical shift change of a particular residue upon ligand binding was calculated as: Δδ=(ωHNΔδHN)2+(ωNΔδN)2+(ωCαΔδCα)2+(ωCβΔδCβ)2+(ωCOΔδCO)2, where ωi denotes the weight factor of nucleus i. ωhn= 1, ωn= 0.154, ωcα= ωcβ =0.276 and ωco= 0.341 (ref. 43). The color code used to display Δδ (in ppm) is as follows: Δδ ∼ 0, dark blue; 0.02 < Δδ < 0.08, light blue; 0.08 < Δδ < 0.2, magenta; 0.2 < Δδ < 0.4, red; 0.4 < Δδ < 0.6, orange; Δδ > 0.7, yellow. Δδ for the cAMP2-CAPN complex reflects the binding effect of the second cAMP molecule on the cAMP1-CAPN complex. Proline residues are colored white.
Figure 3
Figure 3
Effect of the sequential cAMP binding on the slow motions of CAPN. (a) The conformational exchange dynamics on μs-ms time scale, as indicated by the term Rex, are mapped on the structure of the protein as a function of the ligation state. Low values indicate rigidity, whereas higher values indicate flexibility. The color code used to represent Rex (in Hz) is as follows: Rex ∼0, dark blue; 1 < Rex < 4, light blue; 4 < Rex <8, magenta; 8< Rex <12, red; 12< Rex <16, orange; Rex > 16, yellow. (b) Numerical values of Rex for the singly liganded cAMP1-CAPN complex plotted as a function of residue number. Values for the liganded and unliganded subunit are shown in red and blue, respectively. Only residues with Rex higher than 2 Hz are displayed. The secondary structure boundaries are according to the X-ray structure of cAMP2-CAP complex (PDB 1G6N).
Figure 4
Figure 4
CPMG relaxation dispersion data of 15N backbone amides of CAPN. (a) Representative curves for residues of the liganded subunit of the cAMP1-CAPN complex. kex is 1,100 ± 320 s-1 for Leu113, 1,350 ± 290 s-1 for Ile97, 1,200 ± 250 s-1 for Lys44, and 1,150 ± 240 s-1 for Tyr41. (b) Representative curves for residues of the unliganded subunit of the cAMP1-CAPN complex. kex is 1,100 ± 330 s-1 for Met120, 1,820 ± 360 s-1 for Ile106, 1,180 ± 220 s-1 for Ala95, and 1,3200 ± 240 s-1 for Leu29.
Figure 5
Figure 5
Effect of the sequential cAMP binding on the fast motions of CAPN. (a) The amplitude of the motions on ps-ns time scale is indicated by the spectral density function J(0.87ωh). The magnitude of J(0.87ωh) is mapped in a continuous-scale color onto the structure as a function of the ligation state. Low values indicate rigidity, whereas higher values indicate flexibility. (b) Numerical values of J(0.87ωh) plotted as a function of residue number. The color code used is as follows: apo-CAPN, blue; liganded subunit of the cAMP1-CAPN complex, green; unliganded subunit of the cAMP1-CAPN complex, orange; doubly liganded cAMP2-CAPN complex, red.
Figure 6
Figure 6
Effect of the sequential binding of cAMP to CAPN on the amide exchange rates. The effect is presented as the ratio of exchange rates kex1/kex2 induced by each cAMP binding to CAPN, where kex1 and kex2 refer to the state prior and post cAMP binding, respectively. Lower exchange rates indicate higher protection of the amide hydrogens against exchange with solvent deuterons. Thus, higher values of the kex1/kex2 ratio indicate decreased protein flexibility and increased protection. Higher protection denotes narrowing of the population of the protein conformational ensemble as conformations from which exchange take place are less populated. Residues with no detectable protection are colored white. Because exchange rates were measured for all states (apo-CAPN, cAMP1-CAPN, and cAMP2-CAPN) under identical conditions, kex values can be directly compared.
Figure 7
Figure 7
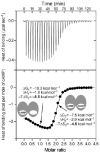
Energetics of the cooperative sequential binding of cAMP to CAPN. ITC traces (upper panel) and binding isotherm (lower panel) of the calorimetric titration of 0.6 mM cAMP to 30 μM CAPN at 30 °C. The solid line represents the fit to a sequential binding site model. The individual thermodynamic parameters obtained for the first and second binding step of cAMP are included in the figure. Dissociation constants are 0.04 μM and 4 μM for the first and second cAMP binding step, respectively.
Figure 8
Figure 8
Effect of the sequential binding of cAMP on the order parameters of CAPN. The magnitude of the change in the order parameter, ΔS2, is mapped in a continuous-scale color onto the structure. Residues with negative ΔS2 values are colored white. ΔS2 is given as S2 (after binding) - S2 (before binding), so that positive ΔS2 values denote enhanced rigidity of the protein backbone upon binding. The conformational entropic penalty that accompanies the binding of the second cAMP (18.1 kcal mol-1) is much larger than the corresponding penalty of the first cAMP binding (3.2 kcal mol-1). Numerical values of ΔS2 are provided in Supplementary Figure 5.
Figure 9
Figure 9
Overall effect of the sequential cAMP binding to the conformation and dynamics of CAPN. In the absence of cAMP (apo state) CAPN exhibits considerable flexibility on the ps-ns time scale and limited stability (enhanced H/D exchange rates). The cAMP binding sites are also flexible (denoted by wavy lines). Binding of the first cAMP molecule has little effect on the ps-ns and H/D exchange rates, but it activates the slow motions (μs-ms) of both subunits. While the conformation of the liganded subunit of the cAMP1-CAPN complex is extensively affected, the conformation of the unliganded subunit is not perturbed. Subsequent binding of the second cAMP molecule suppresses drastically both slow and fast motions and increases stability (lower H/D exchange rates). The much lower favorable entropy change that accompanies the second cAMP binding over the first one is the source of the negative cooperativity. Red and blue indicate activated and suppressed motions, respectively. A change in the mean conformation is indicated by the overall shape of each subunit.

References

    1. Hardy JA, Wells JA. Searching for new allosteric sites in enzymes. Curr Opin Struct Biol. 2004;14:706–715. - PubMed
    1. Gao ZG, Jacobson KA. Allosterism in membrane receptors. Drug Discov Today. 2006;11:191–202. - PMC - PubMed
    1. Swain JF, Gierasch LM. The changing landscape of protein allostery. Curr Opin Struct Biol. 2006;16:102–108. - PubMed
    1. Suel GM, Lockless SW, Wall MA, Ranganathan R. Evolutionarily conserved networks of residues mediate allosteric communication in proteins. Nat Struct Biol. 2003;10:59–69. - PubMed
    1. Koshland DE., Jr Conformational changes: how small is big enough. Nat Med. 1998;4:1112–1114. - PubMed

Publication types

MeSH terms