. 2006 Aug 14:6:37.
doi: 10.1186/1472-6750-6-37.

Critical points of DNA quantification by real-time PCR--effects of DNA extraction method and sample matrix on quantification of genetically modified organisms

Affiliations

Critical points of DNA quantification by real-time PCR--effects of DNA extraction method and sample matrix on quantification of genetically modified organisms

Katarina Cankar et al. BMC Biotechnol. .

Abstract

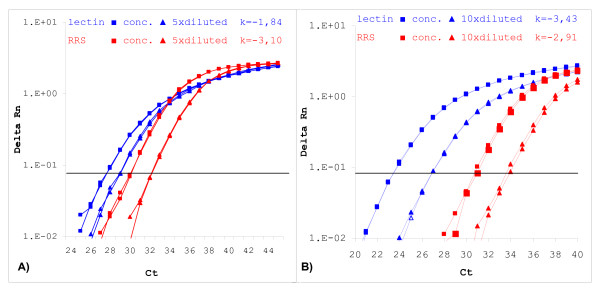
Background: Real-time PCR is the technique of choice for nucleic acid quantification. In the field of detection of genetically modified organisms (GMOs) quantification of biotech products may be required to fulfil legislative requirements. However, successful quantification depends crucially on the quality of the sample DNA analyzed. Methods for GMO detection are generally validated on certified reference materials that are in the form of powdered grain material, while detection in routine laboratories must be performed on a wide variety of sample matrixes. Due to food processing, the DNA in sample matrixes can be present in low amounts and also degraded. In addition, molecules of plant origin or from other sources that affect PCR amplification of samples will influence the reliability of the quantification. Further, the wide variety of sample matrixes presents a challenge for detection laboratories. The extraction method must ensure high yield and quality of the DNA obtained and must be carefully selected, since even components of DNA extraction solutions can influence PCR reactions. GMO quantification is based on a standard curve, therefore similarity of PCR efficiency for the sample and standard reference material is a prerequisite for exact quantification. Little information on the performance of real-time PCR on samples of different matrixes is available.

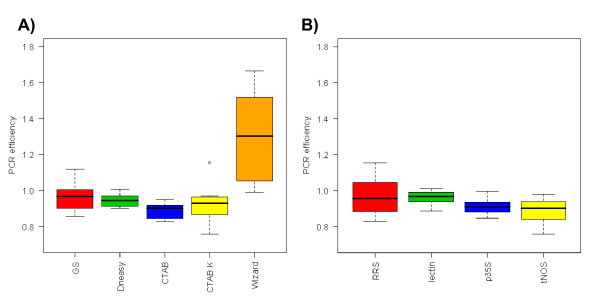
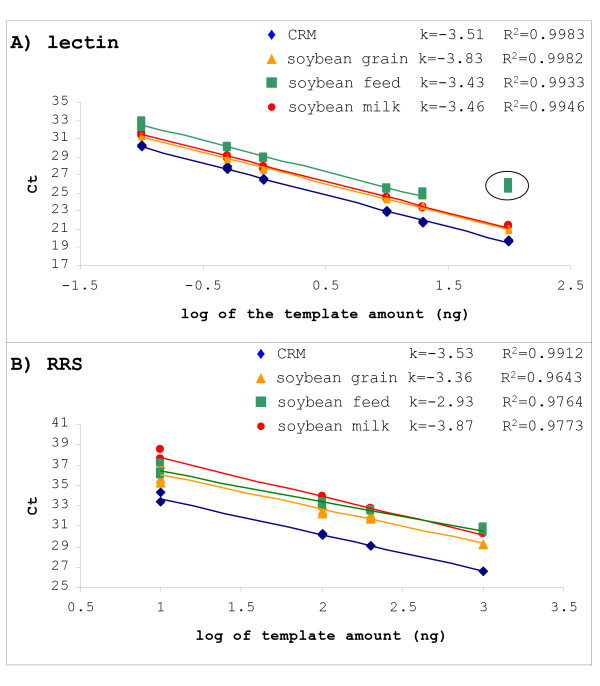
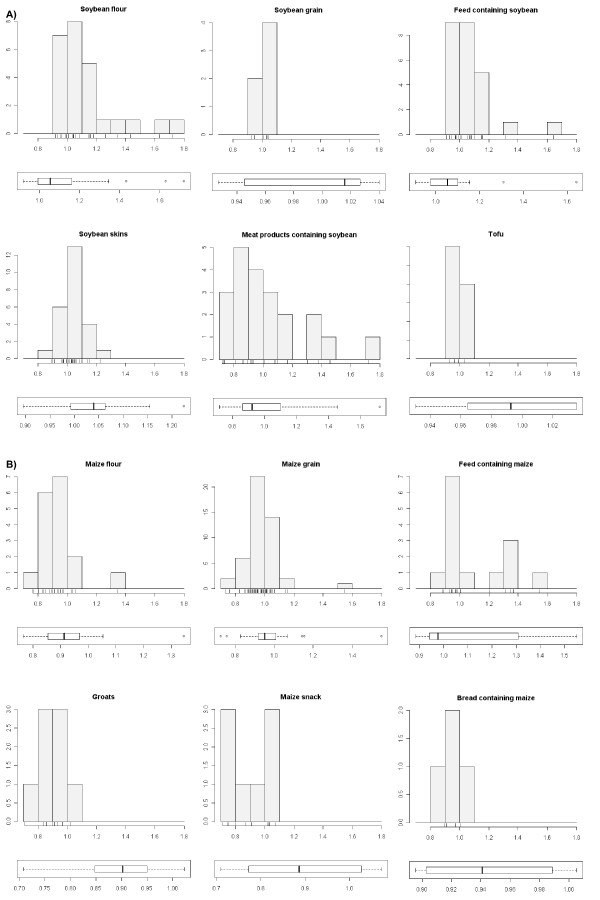
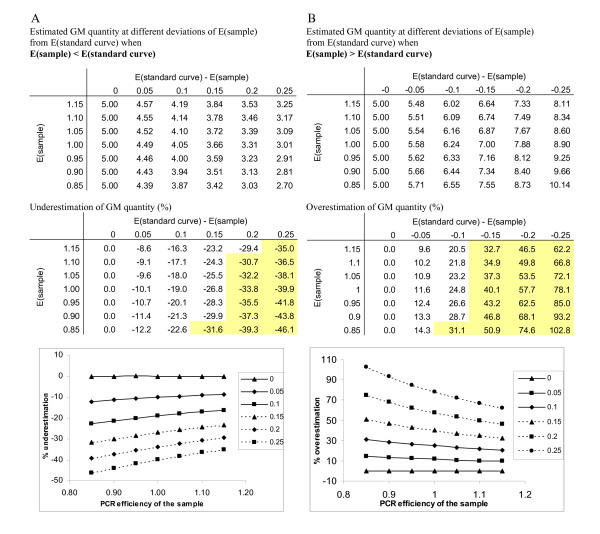
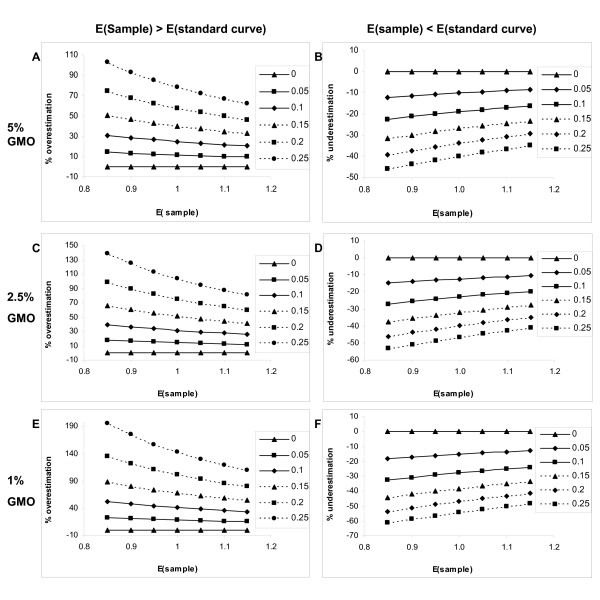
Results: Five commonly used DNA extraction techniques were compared and their suitability for quantitative analysis was assessed. The effect of sample matrix on nucleic acid quantification was assessed by comparing 4 maize and 4 soybean matrixes. In addition 205 maize and soybean samples from routine analysis were analyzed for PCR efficiency to assess variability of PCR performance within each sample matrix. Together with the amount of DNA needed for reliable quantification, PCR efficiency is the crucial parameter determining the reliability of quantitative results, therefore it was chosen as the primary criterion by which to evaluate the quality and performance on different matrixes and extraction techniques. The effect of PCR efficiency on the resulting GMO content is demonstrated.

Conclusion: The crucial influence of extraction technique and sample matrix properties on the results of GMO quantification is demonstrated. Appropriate extraction techniques for each matrix need to be determined to achieve accurate DNA quantification. Nevertheless, as it is shown that in the area of food and feed testing matrix with certain specificities is impossible to define strict quality controls need to be introduced to monitor PCR. The results of our study are also applicable to other fields of quantitative testing by real-time PCR.


Figures

Figure 1
Figure 1
Influence of the DNA extraction method on PCR efficiency. (A) Variability of PCR efficiency for different DNA isolation methods. Outlier for the CTAB procedure with proteinase K and RNase A treatment is shown as circle above the boxplot. (GS = GENESpin, CTAB.K = CTAB procedure with proteinase K and RNase A treatment). (B) The distribution of PCR efficiencies of 4 tested amplicons on different DNA extracts is presented in boxplots (efficiency data for DNA isolated with Wizard method was excluded because of high variability of results).
Figure 2
Figure 2
Efficiency of amplification in 4 soybean matrixes. Standard curves made by serial dilution of DNA isolated from 4 sample matrixes are shown for (A) the species specific gene (lectin) and (B) the transgene (RRS). The position of RRS curves for food materials is shifted from the CRM standard curve due to lower content of GM material in spiked food samples, as expected. The slope and correlation coefficient of the linear regression line are given. The highest concentration of soybean feed DNA was inhibited in the lectin and therefore excluded from the standard curve (encircled in plot A).
Figure 3
Figure 3
Variability of PCR efficiency within matrixes. PCR efficiencies for soybean (A) and maize (B) matrixes were determined for the plant specific genes, lectin and invertase, respectively. The dispersions of PCR efficiencies is shown in a histogram with PCR efficiency on the x axis and number of samples on the y axis. For a scaled view and detection of outliers, boxplots of efficiency data for each matrix are presented below each histogram.
Figure 4
Figure 4
Differential effect on PCR efficiency of amplicons. The differential influence on PCR reaction for two amplicons is shown for two samples of soybean obtained in routine analyses. Although the same amount of DNA was added to each PCR reaction, inhibition was evident for the lectin amplicon but not for the RRS specific amplicon for a soybean feed sample (A). In the case of soybean flour (B), efficiency of the PCR reaction was lower for the RRS amplicon and differed substantially from that for the lectin amplicon. (k = calculated slope of the standard curve linear regression line).
Figure 5
Figure 5
Influence of PCR efficiency on accuracy of GM content determination. The effect of PCR efficiency on the estimated GM content is shown for a theoretical case of 5% GMO when (A) PCR efficiency of the sample is higher then the PCR efficiency of the standard curve and when (B) the PCR efficiency of the sample is lower then the PCR efficiency of the standard curve. Effect of the difference of PCR efficiencies was modelled when E(sample) deviates form E(standard curve) for 0, 0.05, 0.10, 0.15, 0.20 and 0.25. Upper table (in both A and B) shows the determined GM percentage at different deviations of PCR efficiency. Lower table shows the deviation of the estimated GM content from true value in %. Results that deviate from true value for more then 30% are shaded in yellow. In the plots dependency of the of under- or overestimation of the GM content on the PCR efficiency of the sample is shown when E(sample) deviates form E(standard curve) for 0, 0.05, 0.10, 0.15, 0.20 and 0.25. (E = PCR efficiency).
Figure 6
Figure 6
Influence of PCR efficiency on GM content determination at different GM concentration ranges. Deviation of the estimated GM content from the true value (in %) is shown when E(sample) deviates form E(standard curve) for 0, 0.05, 0.10, 0.15, 0.20 and 0.25. Overestimation of GM content (in %) when PCR efficiency of the sample E(sample) is higher then the PCR efficiency of the standard curve is shown for 5% (A), 2.5% (C) and 1% GMO (E). Underestimation of GM content (in %) when PCR efficiency of the sample E(sample) is lower then the PCR efficiency of the standard curve is shown for 5% (B), 2.5% (D) and 1% GMO (F). (E = PCR efficiency).

References

    1. James C. Highlights of ISAAA briefs no. 34-2005 Global status of commercialized biotech/GM crops. ISAAA. 2005.
    1. Miraglia M, Berdal KG, Brera C, Corbisier P, Holst-Jensen A, Kok EJ, Marvin HJ, Schimmel H, Rentsch J, van Rie JP, Zagon J. Detection and traceability of genetically modified organisms in the food production chain. Food Chem Toxicol. 2004;42:1157–1180. doi: 10.1016/j.fct.2004.02.018. - DOI - PubMed
    1. Holst-Jensen A, Ronning SB, Lovseth A, Berdal KG. PCR technology for screening and quantification of genetically modified organisms (GMOs) Anal Bioanal Chem. 2003;375:985–993. - PubMed
    1. Lipp M, Shillito R, Giroux R, Spiegelhalter F, Charlton S, Pinero D, Song P. Polymerase chain reaction technology as analytical tool in agricultural biotechnology. J AOAC Int. 2005;88:136–155. - PubMed
    1. Bubner B, Gase G, Baldwin IT. Two-fold differences are the detection limit for determining transgene copy numbers in plants by real-time PCR. BMC Biotechnol. 2004;4:14. doi: 10.1186/1472-6750-4-14. - DOI - PMC - PubMed

Publication types

MeSH terms

LinkOut - more resources