

A general pipeline for the development of anchor markers for comparative genomics in plants
- PMID: 16907970
- PMCID: PMC1570147
- DOI: 10.1186/1471-2164-7-207
A general pipeline for the development of anchor markers for comparative genomics in plants
Abstract
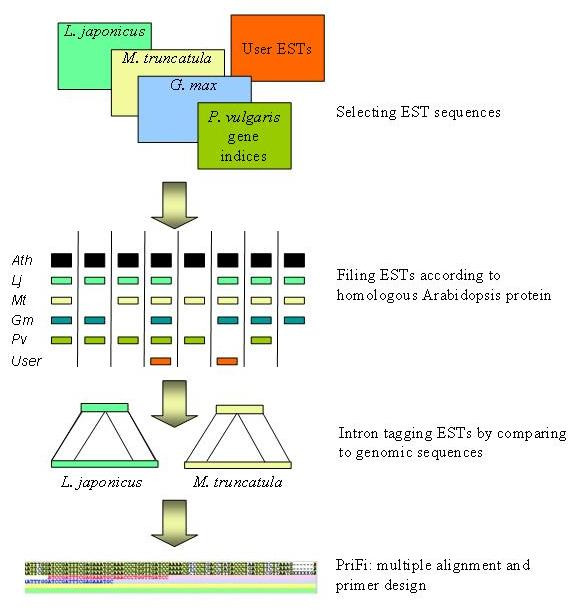
Background: Complete or near-complete genomic sequence information is presently only available for a few plant species representing a large phylogenetic diversity among plants. In order to effectively transfer this information to species lacking sequence information, comparative genomic tools need to be developed. Molecular markers permitting cross-species mapping along co-linear genomic regions are central to comparative genomics. These "anchor" markers, defining unique loci in genetic linkage maps of multiple species, are gene-based and possess a number of features that make them relatively sparse. To identify potential anchor marker sequences more efficiently, we have established an automated bioinformatic pipeline that combines multi-species Expressed Sequence Tags (EST) and genome sequence data.
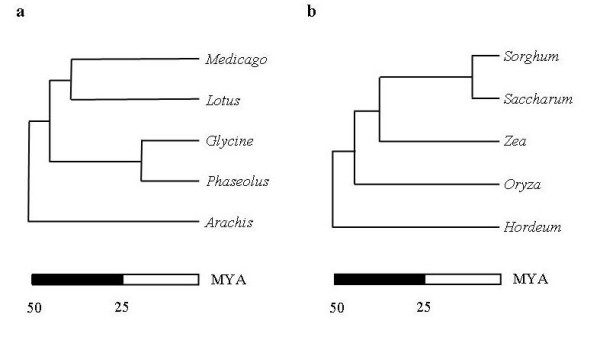
Results: Taking advantage of sequence data from related species, the pipeline identifies evolutionarily conserved sequences that are likely to define unique orthologous loci in most species of the same phylogenetic clade. The key features are the identification of evolutionarily conserved sequences followed by automated design of intron-flanking Polymerase Chain Reaction (PCR) primer pairs. Polymorphisms can subsequently be identified by size- or sequence variation of PCR products, amplified from mapping parents or populations. We illustrate our procedure in legumes and grasses and exemplify its application in legumes, where model plant studies and the genome- and EST-sequence data available have a potential impact on the breeding of crop species and on our understanding of the evolution of this large and diverse family.
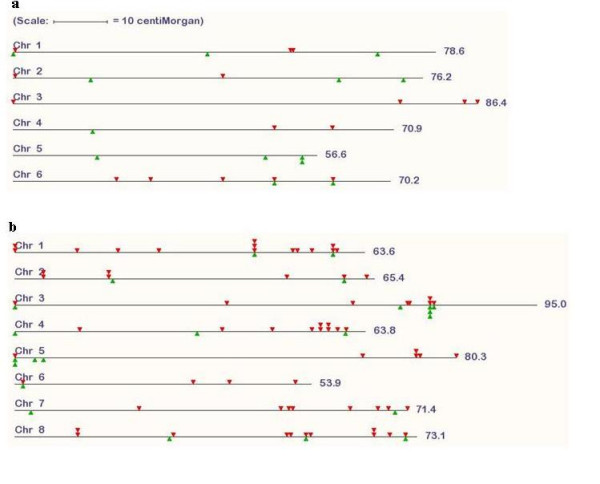
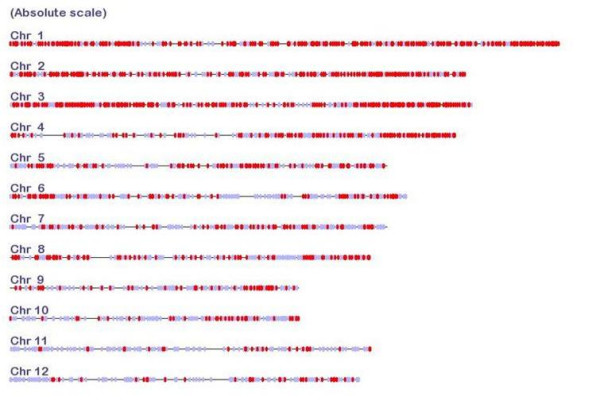
Conclusion: We provide a database of 459 candidate anchor loci which have the potential to serve as map anchors in more than 18,000 legume species, a number of which are of agricultural importance. For grasses, the database contains 1335 candidate anchor loci. Based on this database, we have evaluated 76 candidate anchor loci with respect to marker development in legume species with no sequence information available, demonstrating the validity of this approach.
Figures
References
-
- Yu J, Hu S, Wang J, Wong GK, Li S, Liu B, Deng Y, Dai L, Zhou Y, Zhang X, Cao M, Liu J, Sun J, Tang J, Chen Y, Huang X, Lin W, Ye C, Tong W, Cong L, Geng J, Han Y, Li L, Li W, Hu G, Huang X, Li W, Li J, Liu Z, Li L, Liu J, Qi Q, Liu J, Li L, Li T, Wang X, Lu H, Wu T, Zhu M, Ni P, Han H, Dong W, Ren X, Feng X, Cui P, Li X, Wang H, Xu X, Zhai W, Xu Z, Zhang J, He S, Zhang J, Xu J, Zhang K, Zheng X, Dong J, Zeng W, Tao L, Ye J, Tan J, Ren X, Chen X, He J, Liu D, Tian W, Tian C, Xia H, Bao Q, Li G, Gao H, Cao T, Wang J, Zhao W, Li P, Chen W, Wang X, Zhang Y, Hu J, Wang J, Liu S, Yang J, Zhang G, Xiong Y, Li Z, Mao L, Zhou C, Zhu Z, Chen R, Hao B, Zheng W, Chen S, Guo W, Li G, Liu S, Tao M, Wang J, Zhu L, Yuan L, Yang H. A draft sequence of the rice genome (Oryza sativa L. ssp. indica) Science. 2002;296:79–92. doi: 10.1126/science.1068037. - DOI - PubMed
Publication types
MeSH terms
Substances
LinkOut - more resources
Full Text Sources
Research Materials
