. 2006 Aug 14:7:378.
doi: 10.1186/1471-2105-7-378.

Comprehensive quality control utilizing the prehybridization third-dye image leads to accurate gene expression measurements by cDNA microarrays

Affiliations

Comprehensive quality control utilizing the prehybridization third-dye image leads to accurate gene expression measurements by cDNA microarrays

Xujing Wang et al. BMC Bioinformatics. .

Abstract

Background: Gene expression profiling using microarrays has become an important genetic tool. Spotted arrays prepared in academic labs have the advantage of low cost and high design and content flexibility, but are often limited by their susceptibility to quality control (QC) issues. Previously, we have reported a novel 3-color microarray technology that enabled array fabrication QC. In this report we further investigated its advantage in spot-level data QC.

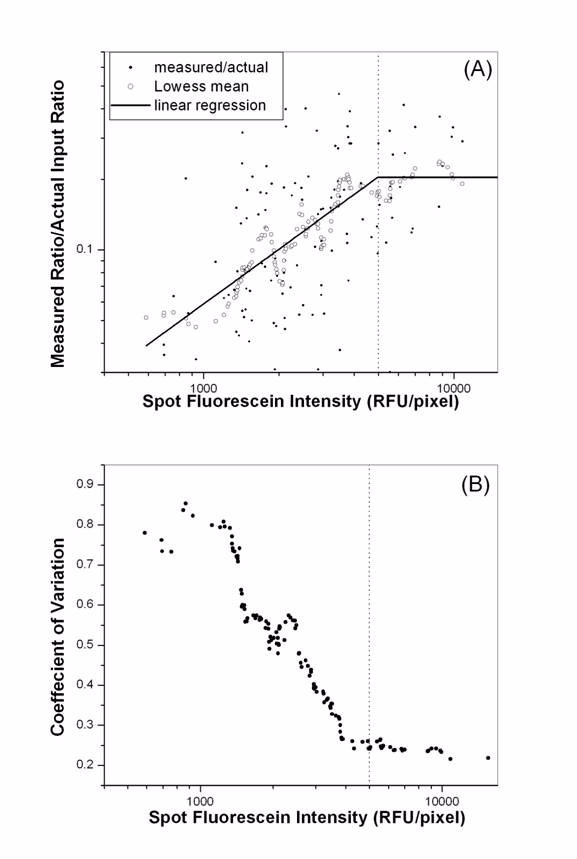
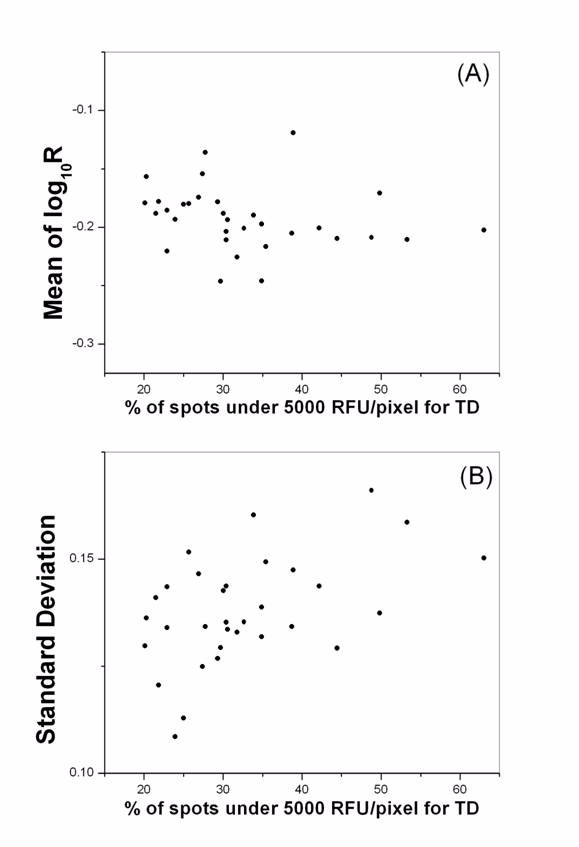
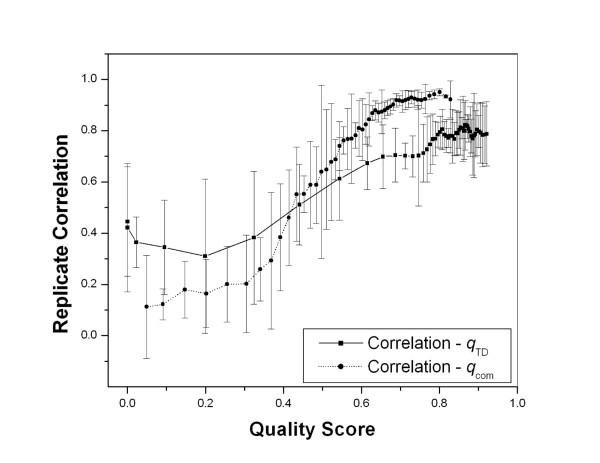
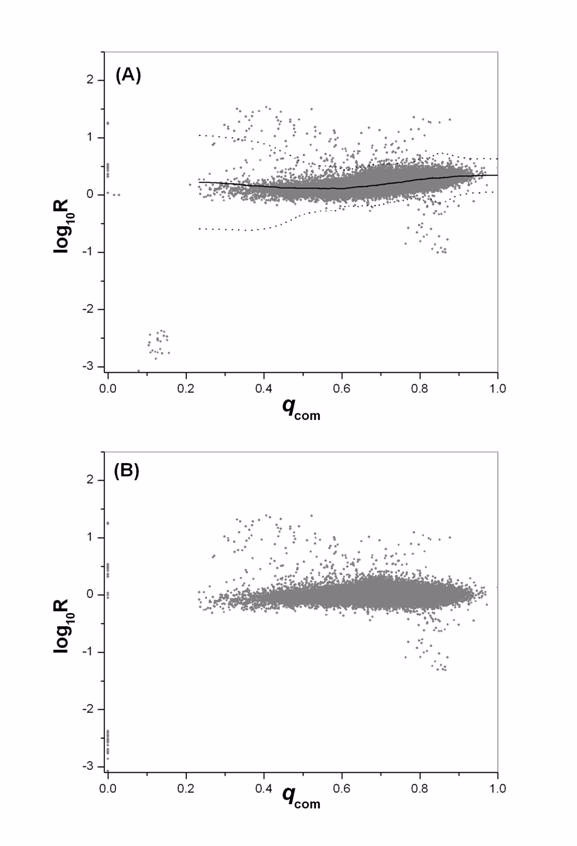
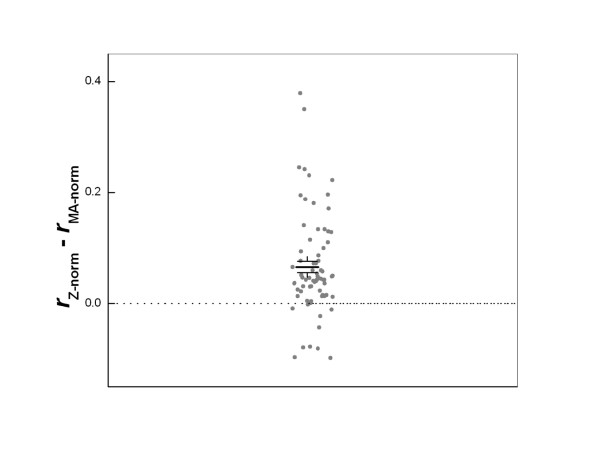
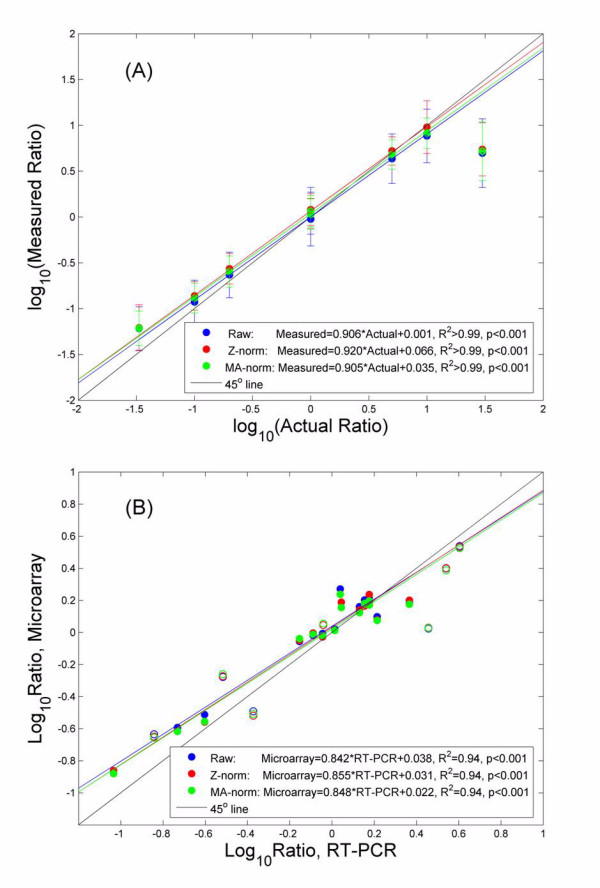
Results: We found that inadequate amount of bound probes available for hybridization led to significant, gene-specific compression in ratio measurements, increased data variability, and printing pin dependent heterogeneities. The impact of such problems can be captured through the definition of quality scores, and efficiently controlled through quality-dependent filtering and normalization. We compared gene expression measurements derived using our data processing pipeline with the known input ratios of spiked in control clones, and with the measurements by quantitative real time RT-PCR. In each case, highly linear relationships (R2 > 0.94) were observed, with modest compression in the microarray measurements (correction factor < 1.17).

Conclusion: Our microarray analytical and technical advancements enabled a better dissection of the sources of data variability and hence a more efficient QC. With that highly accurate gene expression measurements can be achieved using the cDNA microarray technology.


Figures

Figure 1
Figure 1
Increased data compression and variability with decreasing spot TD intensity. Data presented are from the Arabidopsis clone spiked in at a ratio of 30:1. (A) Significant further data compression occurred when spot TD intensity falls below 5,000 RFU/pixel. '•' are individual data points, 'o' represent the LOWESS mean of data, and the straight-line is the linear regression. (B) CV in ratio measurements was presented against spot TD intensity. Data variability increased significantly when spot TD intensity falls below 5,000 RFU/pixel.
Figure 2
Figure 2
The disparity in the amount of probe printed is a major source of pin difference in microarrays. Using one hybridization from the rat thymus experiment, we calculated the mean (A) and the SD (B) in log ratio for data under each pin, and plotted them against the percentage of spots with TD intensity below 5,000 RFU/pixel. There is a clear increase of SD when there are more poor-quality spots under the corresponding pin.
Figure 3
Figure 3
Data filtering utilizing quality scores. The correlation coefficients (mean and SD) between the 6 direct replicate hybridization pairs in data set 4 is plotted against the quality scores qTD and qcom, showing that filtering by either will improve the replicate consistency.
Figure 4
Figure 4
Quality dependent data filtering and normalization. Data are from one hybridization between day 65 and day 40 DP rats of experiment 1. (A) Log ratio distribution before normalization is plotted against qcom. Spots with qcom < 0.20 exhibit significantly increased variability, and will be reset to qcom = 0. Normalization will be performed for all spots with qcom > 0.20. Also shown are the normalization factor (solid line) and the local 3 SD from mean (dotted line). (B) The same data after filtering and normalization.
Figure 5
Figure 5
Comparison of Z-norm and MA-norm methods. Data shown are the differences in the correlation coefficients r between all 74 direct replicate pairs from the four data sets using the two normalization approaches. X-axis values are random numbers assigned to each data point in order to separate them. For most cases, Z-norm leads to better replicate correlations. The solid lines show the mean difference and the standard error of the mean. The difference is significant with p < 0.0001.
Figure 6
Figure 6
Accuracy of gene expression measurements by our microarray platform. (A) The measured ratio is compared with the actual ratio, using raw ratio measurements (Raw), ratio after our normalization pipeline (Z-norm), and ratio after MA-LOWESS normalization (MA-norm). Good agreements between measured and actual are observed. The last data point is excluded from the linear regressions. (B) Measurements by microarray are compared with those by RT-PCR in the rat liver experiment. Again a highly linear relationship is observed, with very small compression in the microarray measurements. Our method exhibits a moderate, insignificant improvement over MA-norm. Seven genes with poor quality microarray data (open circles) were excluded from the linear regression.

References

    1. Brown PO, Botstein D. Exploring the new world of the genome with DNA microarrays. Nat Genet. 1999;21:33–37. doi: 10.1038/4462. - DOI - PubMed
    1. Segal E, Shapira M, Regev A, Pe'er D, Botstein D, Koller D, Friedman N. Module networks: identifying regulatory modules and their condition-specific regulators from gene expression data. Nat Genet. 2003;34:166–176. - PubMed
    1. Ideker T, Thorsson V, Ranish JA, Christmas R, Buhler J, Eng JK, Bumgarner R, Goodlett DR, Aebersold R, Hood L. Integrated genomic and proteomic analyses of a systematically perturbed metabolic network. Science. 2001;292:929–934. doi: 10.1126/science.292.5518.929. - DOI - PubMed
    1. Miklos GL, Maleszka R. Microarray reality checks in the context of a complex disease. Nat Biotechnol. 2004;22:615–621. doi: 10.1038/nbt965. - DOI - PubMed
    1. Chuaqui RF, Bonner RF, Best CJ, Gillespie JW, Flaig MJ, Hewitt SM, Phillips JL, Krizman DB, Tangrea MA, Ahram M, Linehan WM, Knezevic V, Emmert-Buck MR. Post-analysis follow-up and validation of microarray experiments. Nat Genet. 2002;32:509–514. doi: 10.1038/ng1034. - DOI - PubMed

Publication types

MeSH terms

LinkOut - more resources