

Mixing patterns and the spread of close-contact infectious diseases
- PMID: 16907980
- PMCID: PMC1562421
- DOI: 10.1186/1742-7622-3-10
Mixing patterns and the spread of close-contact infectious diseases
Abstract
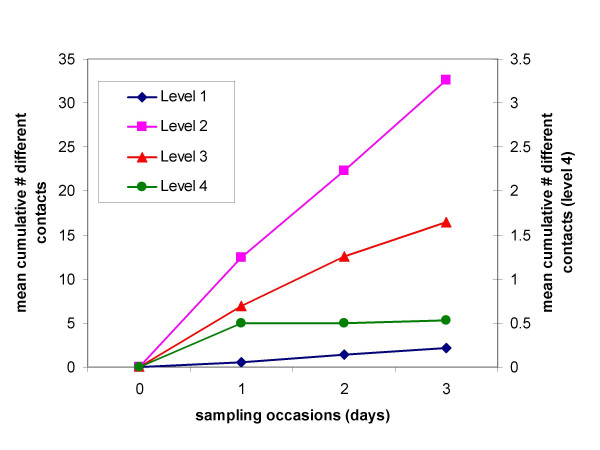
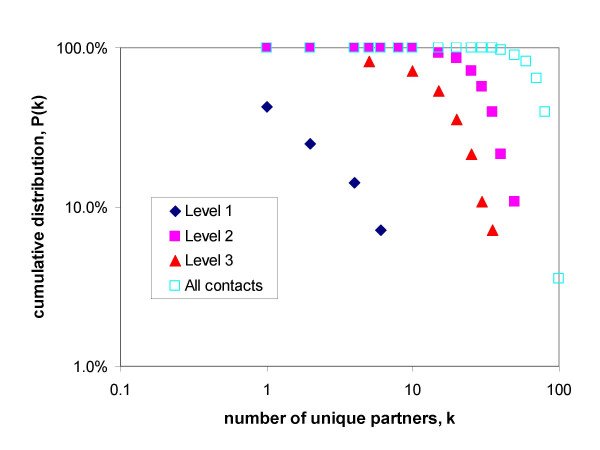
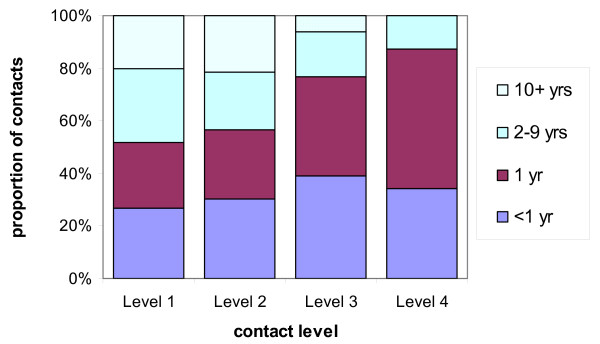
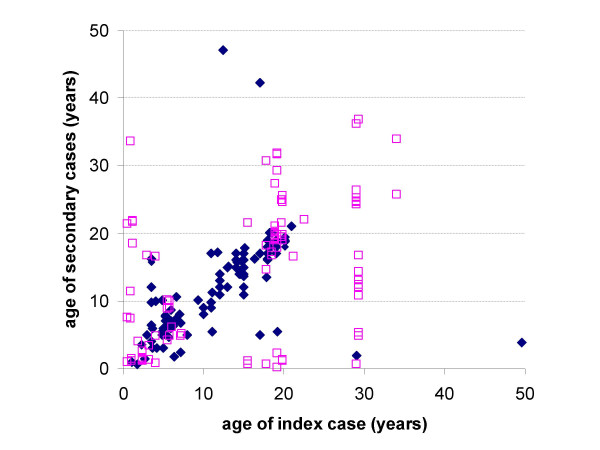
Surprisingly little is known regarding the human mixing patterns relevant to the spread of close-contact infections, such as measles, influenza and meningococcal disease. This study aims to estimate the number of partnerships that individuals make, their stability and the degree to which mixing is assortative with respect to age. We defined four levels of putative at-risk events from casual (physical contact without conversation) to intimate (contact of a sexual nature), and asked university student volunteers to record details on those they contacted at these levels on three separate days. We found that intimate contacts are stable over short time periods whereas there was no evidence of repeat casual contacts with the same individuals. The contacts were increasingly assortative as intimacy increased. Such information will aid the development and parameterisation of models of close contact diseases, and may have direct use in outbreak investigations.
Figures
References
-
- Bailey NJT. The mathematical theory of infectious diseases. 2. New York, Macmillan; 1975.
-
- Anderson RM, May RM. Infectious diseases of humans: dynamics and control. Oxford, Oxford University Press; 1991.
-
- Fine PEM. Herd immunity: history, theory, practice. Epidemiol Rev. 1994;15:265–302. - PubMed
-
- Hethcote HW. The mathematics of infectious diseases. SIAM Review. 2000;42:599–653. doi: 10.1137/S0036144500371907. - DOI
-
- Fine PEM, Clarkson JA. Measles in England and Wales. I. An analysis of factors underlying seasonal patterns. Int J Epidemiol. 1982;11:5–14. - PubMed
LinkOut - more resources
Full Text Sources
