. 2006 Nov 25;355(2):152-63.
doi: 10.1016/j.virol.2006.07.012. Epub 2006 Sep 5.

Induction of transcription factor Egr-1 gene expression in astrocytoma cells by Murine coronavirus infection

Affiliations

Induction of transcription factor Egr-1 gene expression in astrocytoma cells by Murine coronavirus infection

Yingyun Cai et al. Virology. .

Abstract

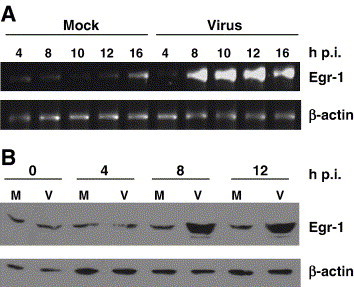
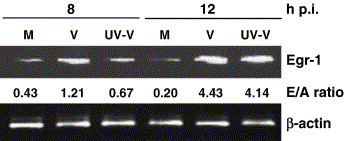
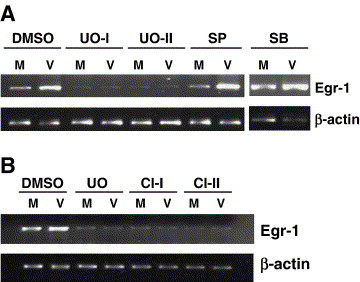
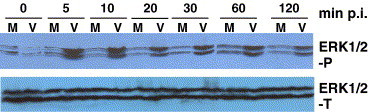
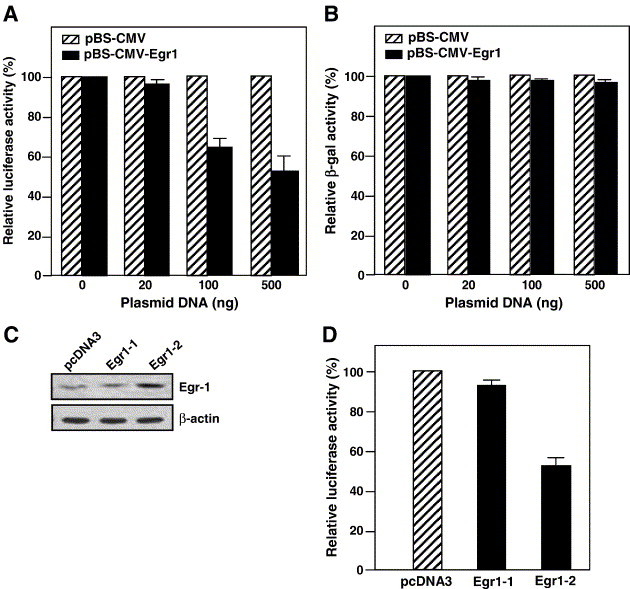
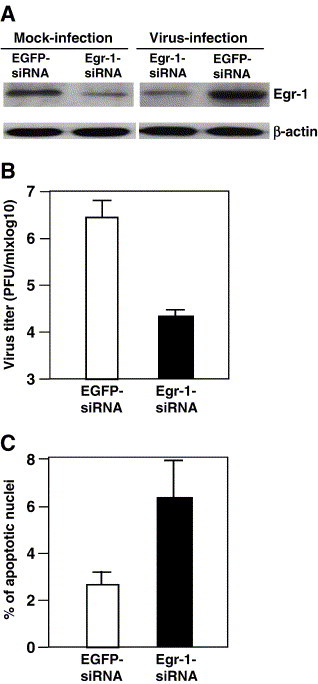
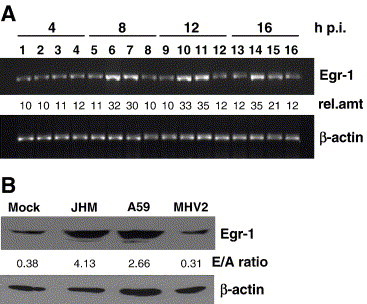
Mouse hepatitis virus (MHV) causes encephalitis and demyelination in the central nervous system (CNS) of susceptible rodents. Astrocytes are one of the major targets for MHV infection in the CNS, and respond to MHV infection by expressing diverse molecules that may contribute to CNS pathogenesis. Here we characterized the activation of an immediate-early transcription factor Egr-1 by MHV infection in an astrocytoma cell line. We found that the expression of Egr-1 was dramatically increased following virus infection. Using various inhibitors of mitogen-activated protein kinases, we identified that the extracellular signal-regulated kinases 1/2 were involved in the activation of Egr-1 transcription by MHV infection. Experiments with ultraviolet light-inactivated virus revealed that the induction of Egr-1 did not require virus replication and was likely mediated during cell entry. We further found that over-expression of Egr-1 suppressed the expression of BNip3, a pro-apoptotic member of the Bcl-2 family. This finding may provide an explanation for our previously observed down-regulation of BNip3 by MHV infection in astrocytoma cells (Cai, Liu, Yu, and Zhang, Virology 316:104-115, 2003). Furthermore, knockdown of Egr-1 by an siRNA inhibited MHV propagation, suggesting the biological relevance of Egr-1 induction to virus replication. In addition, the persistence/demylinating-positive strains (JHM and A59) induced Egr-1 expression, whereas the persistence/demylinating-negative strain (MHV-2) did not. These results indicate a correlation between the ability of MHVs to induce Egr-1 expression and their ability to cause demyelination in the CNS, which may suggest a potential role for the induction of Egr-1 in viral pathogenesis.


Figures

Fig. 1
Fig. 1
Induction of transcription factor Egr-1 expression by MHV-JHM infection. DBT cells were infected with MHV-JHM strain at an m.o.i. of 5 or mock-infected. For mRNA detection (A), intracellular RNAs were isolated at various time points p.i. as indicated. RT-PCR was performed to detect the mRNAs of Egr-1 gene and β-actin, the latter of which was served as an internal control. The RT-PCR products were analyzed by electrophoresis on 2% agarose gel and visualized by staining with ethidium bromide. Images were taken with the digital camera (UVP). For protein detection (B), cells were lysed at various time points p.i. as indicated. Equal amounts of cell lysates were separated by polyacrylamide gel (9%) electrophoresis. Proteins were then transferred to nitrocellulose membranes and were detected with an Egr-1 antibody and enhanced chemiluminescence by Western blot analysis. An aliquot of an equal amount of cell lysates from each sample was used for analyzing the β-actin protein with the β-actin antibody as an internal control. The data are representative of three independent experiments. M, lysates from mock-infected cells; V, lysates from MHV-JHM-infected cells.
Fig. 2
Fig. 2
Egr-1 mRNA expression was induced by both live and UV-irradiated viruses. DBT cells were infected with live or UV-irradiated MHV-JHM or mock-infected. Intracellular RNAs were isolated at 8 and 12 h p.i. RT-PCR was performed to detect Egr-1 mRNA. β-actin was used as an internal control. The RT-PCR products were analyzed by electrophoresis on 2% agarose gel and visualized by staining with ethedium bromide. Images were taken with the digital camera (UVP). The intensity of each band was quantified and the ratio of Egr-1 to β-actin for each sample was presented as E/A ratio. The data are representative of three independent experiments. M, RNAs from mock-infected cells; V, RNAs from MHV-JHM-infected cells; UV-V, RNAs from UV-irradiated MHV-JHM-infected cells.
Fig. 3
Fig. 3
The induction of Egr-1 gene by MHV infection was mediated through the ERK signal pathway. (A) DBT cells were pre-treated with MEK inhibitor UO126 (I: 25 μM or II: 50 μM), JNK inhibitor SP600125 (40 μM), p38 inhibitor SB203580 (40 μM), or DMSO for 1 h prior to infection. These treated cells were then infected with MHV-JHM at an m.o.i. of 5 or mock-infected. At 12 h p.i., the intracellular RNAs were isolated and were subjected to RT with a random primer. cDNAs were amplified by PCR using the primer pair specific to Egr-1 or β-actin (as an internal control). The drugs were present in the medium throughout the 12 h period. The data are representative of three independent experiments. M, RNAs from mock-infected cells; V, RNAs from MHV-JHM infected cells. (B) As in panel A, except that the ERK1/2 inhibitor CI-1040 (CI-I: 3 μM; CI-II: 5 μM) was used and that the concentration of UO126 was 50 μM in this experiment.
Fig. 4
Fig. 4
Activation of ERK signaling pathway by MHV infection. DBT cells were infected with purified MHV-JHM at an m.o.i. of 5 or mock-infected. After 1 h binding at 4 °C, the viral inoculums were removed and fresh medium without serum were added to the plates. The cells were harvested and lysed following incubation at 37 °C for various time points p.i. as indicated. Equal amounts of cell lysates were separated by polyacrylamide gel (10%) electrophoresis. Proteins were then transferred to nitrocellulose membranes and were detected with an antibody specific for phosphorylated-forms of ERK1/2 (ERK1/2-P) and enhanced chemiluminescence by Western blot analysis. An aliquot of an equal amount of cell lysates from each sample was used for analyzing total ERK1/2 (ERK1/2-T) with an antibody specific for ERK1/2 as an internal control. The data are representative of three independent experiments. M, lysates from mock-infected cells; V, lysates from MHV-JHM-infected cells.
Fig. 5
Fig. 5
Inhibition of the BNip3 promoter activity by over-expression of Egr-1. (A) BNip3 promoter activity in transiently transfected cells. DBT cells were transiently cotransfected with the Egr-1 expression plasmid (pBS-CMV-Egr-1) or empty vector (pBS-CMV) at an amount of 0, 20, 100, or 500 ng per well and pGL3-BNip3 reporter plasmid at 500 ng per well. After 20 h post-transfection, cell lysates were harvested, and the luciferase activity was measured. The relative luciferase activity in pBS-CMV-Egr-1-expressing cells is indicated as percentage of the luciferase activity expressed from pBS-CMV-transfected cells, which was set as 100%. Data are the average of a triplicate experiment and are representative of 3 independent experiments. (B) Effect of Egr-1 on SV40 promoter activity. The experiments were performed exactly as in panel A except that the cotransfecting reporter plasmid is pSV-β-gal instead of pGL3-BNip3. (C) Stable expression of Egr-1 in DBT cells. DBT cells were transfected with the Egr-1 expression plasmid (pcDNA3-Egr1) or with empty vector (pcDNA3). Following selection with G418 for more than 1 month, two clones stably expressing Egr-1 were obtained. The expression levels of these two clones were determined by Western blot with an antibody specific to Egr-1. β-actin protein serves as an internal control. (D) BNip3 promoter activity in Egr-1-stable expressing cells. Equal numbers of cells from these two cloned cells or cells stably transfected with pcDNA3 empty vector were cotransfected with pGL3-BNip3 reporter plasmid and pSV-β-gal plasmid, the latter of which was used as a control for transfection efficiency. After 24 h post-transfection, the luciferase activity and β-gal activity were measured. The relative luciferase activity in Egr-1-expressing cells (Egr1-1 and Egr1-2) is indicated as percentage of the luciferase activity expressed from pcDNA3-transfected cells, which was set as 100%. The luciferase activity was normalized with β-gal activity. Data are the average of three independent experiments and error bars denote standard deviation.
Fig. 6
Fig. 6
Effect of Egr-1 knockdown on virus propagation and cell survival. (A) Effect of Egr-1-siRNA on Egr-1 expression. DBT cells were transfected with Egr-1-siRNA or EGFP-siRNA for 60 h, and then infected with MHV or mock-infected with PBS. Cells were lysed at 16 h p.i. and proteins were detected by Western blot with anti-Egr-1 or anti-β-actin antibodies (A). Virus titers were determined by virus plaque assay at 16 h p.i. and were expressed as mean ± standard deviation (SD) of three experiments (B). (C) Apoptosis was assessed by determining the apoptotic nuclei following propidium iodide staining, and was expressed as mean percentage of the cell population and SD of three experiments. Statistical analysis indicates significance between the Egr-1 knockdown cells and the control cells (p = 0.037).
Fig. 7
Fig. 7
Differential induction of Egr-1 expression by different MHV strains. (A) Expression of Egr-1 mRNA. DBT cells were infected with different strains of MHVs (including MHV-JHM, A59 and MHV2) or mock-infected. Total intracellular RNAs were isolated at various time points p.i. as indicated. RT-PCR was performed to detect the Egr-1 mRNA. β-actin was used as an internal control. The RT-PCR products were analyzed by electrophoresis on 2% agarose gel and visualized by staining with ethedium bromide. Images were taken with the digital camera (UVP). Lanes 1, 5, 9, and 13: RNAs from mock-infected cells; Lanes 2, 6, 10, and 14: RNAs from cells infected with MHV-JHM; Lanes 3, 7, 11, and 15: RNAs from cells infected with MHV-A59; Lanes 4, 8, 12, and 16: RNAs from cells infected with MHV-2. The intensity of each band was quantified by densitometry (UVP), which is indicated as relative amount (rel. amt) shown beneath each lane. (B) Detection of Egr-1 protein. DBT cells were infected as in panel A. Cells were harvested and lysed at 12 h p.i. Equal amounts of the cell lysates were separated by polyacrylamide gel (9%) electrophoresis. Western blot was performed to detect Egr-1 and β-actin proteins by using an antibody specific to Egr-1 and β-actin, respectively. The intensity of each band was quantified and the relative quantity was expressed as a ratio of Egr-1 to β-actin (E/A ratio) for each sample.

Similar articles

Cited by

References

    1. Adami C., Pooley J., Glomb J., Stecker E., Fazal F., Fleming J.O., Baker S.C. Evolution of mouse hepatitis virus (MHV) during chronic infection: quasispecies nature of the persisting MHV RNA. Virology. 1995;209:337–346. - PMC - PubMed
    1. Banerjee S., Narayanan K., Mizutani T., Makino S. Murine coronavirus replication-induced p38 mitogen-activated protein kinase activation promotes interleukin-6 production and virus replication in cultured cells. J. Virol. 2002;76:5937–5948. - PMC - PubMed
    1. Baron V., De Gregorio G., Krones-Herzig A., Virolle T., Calogero A., Urcis R., Mercola D. Inhibition of Egr-1 expression reverses transformation of prostate cancer cells in vitro and in vivo. Oncogene. 2003;22:4194–4204. - PubMed
    1. Baron V., Duss S., Rhim J., Mercola D. Antisense to the early growth response-1 gene (Egr-1) inhibits prostate tumor development in TRAMP mice. Ann. N. Y. Acad. Sci. 2003;1002:197–216. - PubMed
    1. Bennett B.L., Sasaki D.T., Murray B.W., O'Leary E.C., Sakata S.T., Xu W., Leisten J.C., Motiwala A., Pierce S., Satoh Y., Bhagwat S.S., Manning A.M., Anderson D.W. SP600125, an anthrapyrazolone inhibitor of Jun N-terminal kinase. Proc. Natl. Acad. Sci. U.S.A. 2001;98:13681–13686. - PMC - PubMed

Publication types

MeSH terms

LinkOut - more resources