. 2006 Oct;26(20):7451-65.
doi: 10.1128/MCB.00684-06. Epub 2006 Aug 14.

An hpr1 point mutation that impairs transcription and mRNP biogenesis without increasing recombination

Affiliations

An hpr1 point mutation that impairs transcription and mRNP biogenesis without increasing recombination

Pablo Huertas et al. Mol Cell Biol. 2006 Oct.

Abstract

THO/TREX, a conserved eukaryotic protein complex, is a key player at the interface between transcription and mRNP metabolism. The lack of a functional THO complex impairs transcription, leads to transcription-dependent hyperrecombination, causes mRNA export defects and fast mRNA decay, and retards replication fork progression in a transcription-dependent manner. To get more insight into the interconnection between mRNP biogenesis and genomic instability, we searched for HPR1 mutations that differentially affect gene expression and recombination. We isolated mutants that were barely affected in gene expression but exhibited a hyperrecombination phenotype. In addition, we isolated a mutant, hpr1-101, with a strong defect in transcription, as observed for lacZ, and a general defect in mRNA export that did not display a relevant hyperrecombination phenotype. In THO single-null mutants, but not in the hpr1 point mutants studied, THO and its subunits were unstable. Interestingly, in contrast to hyperrecombinant null mutants, hpr1-101 did not cause retardation of replication fork progression. Transcription and mRNP biogenesis can therefore be impaired by THO/TREX dysfunction without increasing recombination, suggesting that it is possible to separate the mechanism(s) responsible for mRNA biogenesis defects from the further step of triggering transcription-dependent recombination.


Figures
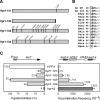
FIG. 1.
FIG. 1.
Genetic characterization of hpr1 point mutations that differentially affect transcription and recombination. (A) Schematic representation of the amino acid substitutions of the hpr1 alleles studied. Mutations that change the amino acid sequence are represented as black bars. (B) Protein alignment of the region surrounding L586 in several Hpr1 orthologs. The Hpr1 protein sequences used belong to the followings organisms: S. cerevisiae wild type and hpr1-101 mutant (Sc WT and Sc 101, respectively), Saccharomyces bayanus (SBay), Homo sapiens (Hsap), Mus musculus (Mmus), Xenopus laevis (Xlae), Brachydanio rerio (Brer), Drosophila melanogaster (Dmel), Saccharomyces kluyveri (Sklu), Caenorhabditis elegans (Cele), Arabidopsis thaliana (Atha), Dictyostelium discoideum (Ddis), Neurospora crassa (Ncra), and Schizosaccharomyces pombe (Spom). (C) β-Galactosidase activity and recombination frequencies of the LAU3-10A (hpr1Δ) strain containing the leu2-k::ADE2-URA3::leu2-k recombination system and transformed with pRS313-GZ (containing the GAL1pr:::lacZ fusion) and with either YCpA13 (HPR1), YCp-hpr1-101 to YCp-hpr1-104 (hpr1-101 to hpr1-104), or the empty vector YCp70. The percentage of β-galactosidase activity with respect to the wild-type level (taken as 100%) is shown. Each value represents the average of two or three independent experiments. The recombination frequencies (10−4) are averages of two to four median frequencies obtained from the same number of fluctuation experiments.
FIG. 2.
FIG. 2.
Recombination in hpr1-101 and hpr1-103 mutants. (A) The isogenic strains W303-1A (WT), WH101-1A (hpr1-101), WH103-1A (hpr1-103), and SChY58a (hpr1Δ), carrying the mutant alleles integrated in the chromosomal HPR1 locus, were transformed with plasmid pSCh204 (L-lacZ recombination assay) or pSCh206 (L-PHO5 recombination assay). Gray boxes represent LEU2 repeats that flank either the PHO5 or the lacZ ORF, as indicated. The white box represents the promoter, and the white solid arrow represents the CYC transcription termination site. Shown are recombination frequencies under repressed conditions (glucose) in cells transformed with plasmid pRS314GLlacZ, containing the GL-lacZ recombination assay, in which transcription is under the control of the GAL1 promoter. The recombination frequencies shown are averages of two to four different experiments. (B) Northern analysis of the L-lacZ and L-PHO5 recombination system in isogenic strains W303-1A (WT [wild type]), WH101-1A (hpr1-101), and SChY58a (hpr1Δ) transformed with either pSCh204 or pSCh206, respectively. Filters were hybridized with either a lacZ or a PHO5 probe and with the 25S rRNA probe. All data were normalized with respect to the rRNA signal. The averages of two experiments are plotted. A.U., arbitrary units.
FIG. 3.
FIG. 3.
Transcription analysis of hpr1-101 versus the wild type and hpr1Δ as a function of GC content and the length of the transcribed DNA sequence. (A) Isogenic strains W303-1A (WT [wild type]), WH101-1A (hpr1-101), and SChY58a (hpr1Δ), carrying the mutant alleles integrated into the chromosomal HPR1 locus, were transformed with pRS316-GAL1lacZ (GAL1pr::lacZ fusion) or pSCh202 (GAL1p::PHO5 fusion). β-Galactosidase or phosphatase activity was defined as the percentage (for lacZ or PHO5, respectively) of the wild-type activity, which was taken as 100%. The mean and standard deviation of three independent experiments are plotted. (B) Northern analysis of mRNA levels in different plasmid constructs containing lacZ (pRS416GAL1lacZ), PHO5 (pSCH202), LAC4 (pSCH255), and YAT1 (pSCH247) under the control of the GAL1 promoter in strains W303-1A (wild type), WH101-1A (hpr1-101), and U768-4C (hpr1Δ). For the analysis of transcription of the YLR454 gene, strain WHYL.2A (hpr1Δ GAL1p::YLR454) was transformed with the empty vector YCpA70 (hpr1Δ) or with plasmid YCpA13 (HPR1) or YCp:hpr1-101 (hpr1-101). Others details are the same as those in Fig. 2B.
FIG. 4.
FIG. 4.
RNA processivity is affected by hpr1-101 in a manner strongly dependent on the GC content and moderately dependent on the length of the transcribed DNA sequence. (A) ChIP assays of RNAPII at the lacZ gene. Experiments were performed with strains W303 (WT [wild type]), WH101-1A (hpr1-101), and U768-4C (hpr1Δ) transformed with plasmid pRS416GAL1lacZ containing lacZ under the control of the GAL1 promoter. ChIPs with regions 1 and 2 and an intergenic region as a control were performed in two different transformants, and PCRs were repeated four times for each transformant. The ratio of DNA in regions 1 and 2 was calculated from the DNA amounts in regions 1 and 2 relative to the DNA amount obtained from the intergenic region. Values were normalized to the amount of DNA in region 1 in each strain, which was set to 100% (for details, see Materials and Methods). (B) ChIP assays of RNAPII at the YLR454 gene under control of the GAL1 promoter. The experiments were performed with strain WHYL.2A (hpr1Δ GAL1p::YLR454) containing either plasmid YCpA13 (HPR1) or YCphpr1-101 (hpr1-101) or the empty vector YCpA70 (hpr1Δ). ChIPs were performed with two different transformants each, and quantitative PCRs were repeated twice for each transformant. Values were normalized to the amount of DNA in region 1 of each transformant, which was set to 100%.
FIG. 5.
FIG. 5.
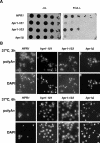
mRNA export defects of hpr1 mutants. (A) Suppression of hpr1Δ mex67-5 synthetic lethality. Strain WMH1 (hpr1Δ mex67-5) transformed with URA3-based plasmid pRS316-HPR1 was additionally transformed with LEU2-based plasmids YCpA13 (HPR1), YCp-hpr1-101 (hpr1-101), and YCp-hpr1-103 (hpr1-103) or the empty vector YCp70 (hpr1Δ). Transformants were spotted in 10-fold serial dilutions on selective medium with or without FOA. Plates were scanned after 3 days of incubation at 30°C. Note that only transformants harboring alleles suppressing the synthetic lethality are able to grow on SC medium-FOA plates. (B) Analysis of nuclear poly(A)+ RNA localization in W303-1A (wild type), WH101-1A (hpr1-101), WH103-1A (hpr1-103), and U768-4C (hpr1Δ) log-phase cultures cultivated for 3 or 6 h at 37°C, as indicated. Samples were immobilized in Teflon-coated slides and hybridized first with a digoxigenin-labeled 20-mer oligo(dT) and second with a fluorescein-conjugated anti-digoxigenin antibody for in situ detection of mRNA. Nuclei were stained with 4′,6′-diamidino-2-phenylindole (DAPI). U, uracil; L, leucine.
FIG. 6.
FIG. 6.
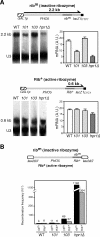
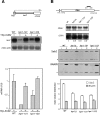
Nascent-mRNA dependency of the transcription and hyperrecombination defects of hpr1 mutants. (A) Kinetic analyses of transcription activation of the ribm and Rib+ fusions in strains W303-1A (WT [wild type]), WH101-1A (hpr1-101), WH103-1A (hpr1-103), and U678-4C (hpr1Δ). The PHO5-ribm-lacZ (ribm) and PHO5-Rib+-lacZ (Rib+) transcriptional fusions were under control of the GAL1 promoter (GAL1p). They contain an active or inactive (respectively), synthetically made, 52-bp ribozyme (Rib), followed by a 266-bp fragment of the U3 gene to prevent the cleaved mRNA from degradation and the 369-bp PvuII 3′-end lacZ fragment at the untranslated region of PHO5 (position +1405). Samples were collected 2 h after galactose addition to activate transcription. Electrophoresis was performed with formaldehyde-agarose gels (ribm) or urea-acrylamide gels (Rib+), and hybridization was with a U3 probe, corresponding to the ribm and Rib+ region in the scheme. All data were normalized with respect to the endogenous U3 signal. The average of three different experiments is plotted. A.U., arbitrary units. (B) Recombination frequencies of wild-type, hpr1, hpr1-101, and hpr1-103 cells containing the recombination systems GL-Rib+ (black bars) and GL-ribm (gray bars) are shown. Each recombination frequency is the median value of six independent colonies. The average median value of two to four experiments and the standard deviation are plotted.
FIG. 7.
FIG. 7.
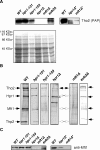
Analysis of the THO complex in different hpr1 mutants. (A) Western analysis (top) and Coomassie staining (bottom) of total protein extracts from isogenic strains WWT2T (WT [wild type]), WTT3-4A (hpr1-101), WTT4-5C (hpr1-103), MTT1 (mft1Δ), STT2 (sub2Δ), and WTT3-4C (hpr1Δ) harboring a Tho2-TAP fusion subjected to SDS-PAGE and hybridized with PAP antibody recognizing the TAP epitope. Either the same amount or a 10-fold excess (marked with an asterisk) of the total proteins shown in the Coomassie-stained gel was loaded for each mutant. (B) Silver-stained gradient SDS-PAGE of purified THO complex from the wild type and hpr1 mutants. The amount of the eluted fraction loaded in each case was calculated to get the same amounts of TAP-purified Tho2 protein. Arrows indicate the bands corresponding to the four THO subunits (black, detectable; white, nondetectable). The two additional bands observed in hpr1Δ strains may correspond to Tho2 degradation products, as suggested by Western analyses (data not shown), but this needs further confirmation. (C) Western analysis of the purified eluted Tho2-TAP fraction subjected to 8% SDS-PAGE and hybridized with anti-Mft1 antibody. Others details are the same as those in panel A. Amounts of protein extracts (marked with an asterisk) similar to those used for panel B or 10-fold excesses were loaded for each mutant.
FIG. 8.
FIG. 8.
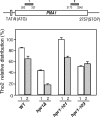
Recruitment of Tho2 to active chromatin in hpr1-101 and hpr1-103 cells, as determined by ChIP analysis of Tho2-TAP to the PMA1 gene. Experiments were performed with strains WWT2T (W303-1A THO2-TAP), WTT3-4A (W303-1A THO2-TAP hpr1-101), WTT3-4C (W303-1A THO2-TAP hpr1Δ::KAN), and WTT4-5C (W303-1A THO2-TAP hpr1-103). For each genotype, ChIPs were performed for two different cultures each and quantitative PCRs were repeated twice for each culture. The scheme of the gene analyzed and the DNA fragments amplified by PCR are shown. Other details are the same as those in Fig. 4. WT, wild type.
FIG. 9.
FIG. 9.
Recruitment of Sub2 to active chromatin in hpr1-101 cells. (A) Suppression of the lacZ gene expression defect of hpr1-101 and hpr1-103 by multicopy SUB2 as determined by Northern analysis. Strains W303-1A (WT [wild type]), WH101-1A (hpr1-101), and WH103-1A (hpr1-103) were transformed with pCM184-LAUR containing the lacZ-URA3 fusion under the control of the tet promoter (scheme on top) and with either multicopy plasmid YEp351-SUB2 carrying SUB2 (+) or empty vector YEp351 (−). The experiment was performed in the presence of doxycycline to induce transcription. Others details are the same as those in Fig. 3. (B) ChIP analysis of Sub2-TAP and RNAPII at the PMA1 gene. The scheme of the genes analyzed and the PCR fragments amplified by PCR are shown at the top, Northern analyses of PMA1 expression in WT and hpr1 strains are shown in the middle, and ChIP results are at the bottom. Experiments were performed with strain BSU-S2T-6D (hpr1Δ) carrying the chromosomal Sub2-TAP construct and transformed with plasmid YCpA13 (HPR1), YCp-hpr1-101 (hpr1-101), or YCp-hpr1-103 (hpr1-103) or the empty vector YCp70 (hpr1Δ). For each genotype, ChIPs were performed with two different transformants each, and PCRs were repeated three times in each case. One representative PAGE gel for each experiment is shown, with the PCR fragment corresponding to the 9716-to-9863 intergenic region of chromosome V used as a control (indicated by an asterisk). The rest of the PCR bands correspond to the specific gene fragments analyzed (see Materials and Methods). The relative abundance of each DNA fragment was calculated as the ratio of each DNA fragment to the intergenic-region quantification results of the precipitated fractions (P) normalized to the corresponding ratios of the input fractions (I).
FIG. 10.
FIG. 10.
Replication fork progression in hpr1-101 and hpr1-103 cells. (A) Scheme of the 6.26-kb pRWY005 yeast plasmid used for this study (left) and 2D gel pattern of predictable replication intermediates upon plasmid linearization (right). Depicted are restriction sites, functional elements (ARS1, open circle; URA3, open arrow; GAL1 promoter, open rectangle; lacZ gene, dashed arrow), and shapes of replication intermediates (a bubble and a Y). (B) 2D gel analysis of replication intermediates within a 3.0-kb SacI-SmaI fragment isolated from cells grown in galactose. The replication intermediates were derived from strains W303-1A (WT [wild type]), SChY58a (hpr1Δ), WH101-1A (hpr1-101), and WH103-1A (hpr1-103) transformed with plasmid pRWY005. The inflection point, containing simple-Y molecules of which each arm has approximately the same length (white arrow), is indicated.

Similar articles

Cited by

References

    1. Abruzzi, K. C., S. Lacadie, and M. Rosbash. 2004. Biochemical analysis of TREX complex recruitment to intronless and intron-containing yeast genes. EMBO J. 23:2620-2631. - PMC - PubMed
    1. Aguilera, A. 2002. The connection between transcription and genomic instability. EMBO J. 21:195-201. - PMC - PubMed
    1. Aguilera, A. 2005. Cotranscriptional mRNP assembly: from the DNA to the nuclear pore. Curr. Opin. Cell Biol. 17:242-250. - PubMed
    1. Aguilera, A., and H. L. Klein. 1990. HPR1, a novel yeast gene that prevents intrachromosomal excision recombination, shows carboxy-terminal homology to the Saccharomyces cerevisiae TOP1 gene. Mol. Cell. Biol. 10:1439-1451. - PMC - PubMed
    1. Amberg, D. C., A. L. Goldstein, and C. N. Cole. 1992. Isolation and characterization of RAT1: an essential gene of Saccharomyces cerevisiae required for the efficient nucleocytoplasmic trafficking of mRNA. Genes Dev. 6:1173-1189. - PubMed

Publication types

MeSH terms