

3T 1H-MR spectroscopy in grading of cerebral gliomas: comparison of short and intermediate echo time sequences
- PMID: 16908549
- PMCID: PMC7977521
3T 1H-MR spectroscopy in grading of cerebral gliomas: comparison of short and intermediate echo time sequences
Abstract
Background and purpose: Echo time (TE) can have a large influence on the spectra in proton MR spectroscopy ((1)H-MR spectroscopy). The purpose of this study was to comparatively assess the diagnostic value of 3T single-voxel (1)H-MR spectroscopy with short or intermediate TEs in grading cerebral gliomas.
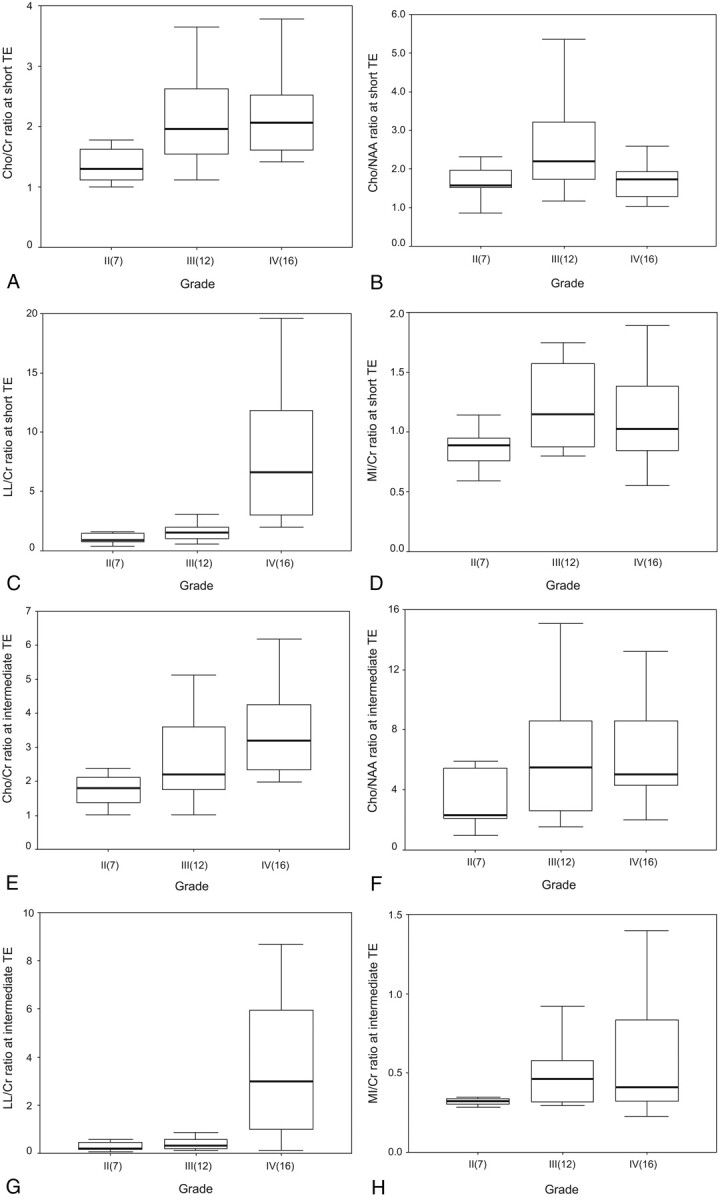
Methods: Single voxel (1)H-MR spectroscopy was performed at 3T in 35 patients with cerebral glioma. The spectra were obtained with both short (35 ms) and intermediate TEs (144 ms). Metabolite ratios of choline (Cho)/creatine (Cr), Cho/N-acetylaspartate (NAA), lipid and lactate (LL)/Cr and myo-inositol (mIns)/Cr were calculated and compared between short and intermediate TEs in each grade. After receiver operating characteristic curve analysis, diagnostic accuracy for each TE in differentiating high-grade glioma from low-grade glioma was compared.
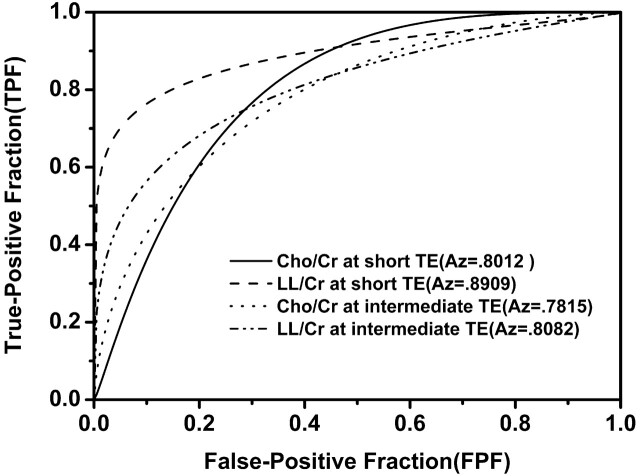
Results: At short TE, Cho/Cr and Cho/NAA ratios were significantly lower, and LL/Cr and mIns/Cr were significantly higher, compared with those at intermediate TE, regardless of tumor grade. Lactate inversion at intermediate TE was found in only 2 patients. At both TEs, there were significant differences in Cho/Cr and LL/Cr ratios between low- and high-grade gliomas. Diagnostic accuracy was slightly higher at short TE alone or combined with intermediate TE than intermediate TE alone (85.7% versus 82.9%).
Conclusion: Metabolite ratios were significantly different between short and intermediate TE. Cho/Cr and LL/Cr ratios at either TE were similarly useful in differentiating high-grade gliomas from low-grade gliomas. If only a single spectroscopic sequence can be acquired, short TE seems preferable because of poor lactate inversion at intermediate TE on 3T single-voxel (1)H-MR spectroscopy.
Figures
Similar articles
-
Proton magnetic resonance spectroscopy in the distinction of high-grade cerebral gliomas from single metastatic brain tumors.Acta Radiol. 2010 Apr;51(3):316-25. doi: 10.3109/02841850903482901. Acta Radiol. 2010. PMID: 20092374
-
Measurements of diagnostic examination performance using quantitative apparent diffusion coefficient and proton MR spectroscopic imaging in the preoperative evaluation of tumor grade in cerebral gliomas.Eur J Radiol. 2011 Nov;80(2):462-70. doi: 10.1016/j.ejrad.2010.07.017. Epub 2010 Aug 13. Eur J Radiol. 2011. PMID: 20708868
-
Glioma grading: sensitivity, specificity, and predictive values of perfusion MR imaging and proton MR spectroscopic imaging compared with conventional MR imaging.AJNR Am J Neuroradiol. 2003 Nov-Dec;24(10):1989-98. AJNR Am J Neuroradiol. 2003. PMID: 14625221 Free PMC article.
-
Potential of MR spectroscopy for assessment of glioma grading.Clin Neurol Neurosurg. 2013 Feb;115(2):146-53. doi: 10.1016/j.clineuro.2012.11.002. Epub 2012 Dec 10. Clin Neurol Neurosurg. 2013. PMID: 23237636 Review.
-
3 Tesla magnetic resonance spectroscopy: cerebral gliomas vs. metastatic brain tumors. Our experience and review of the literature.Int J Neurosci. 2013 Aug;123(8):537-43. doi: 10.3109/00207454.2013.774395. Epub 2013 Mar 11. Int J Neurosci. 2013. PMID: 23390934 Review.
Cited by
-
MR imaging characteristics of protoplasmic astrocytomas.Neuroradiology. 2011 Jun;53(6):405-11. doi: 10.1007/s00234-010-0741-2. Epub 2010 Jul 20. Neuroradiology. 2011. PMID: 20644924
-
A quantitative SVM approach potentially improves the accuracy of magnetic resonance spectroscopy in the preoperative evaluation of the grades of diffuse gliomas.Neuroimage Clin. 2019;23:101835. doi: 10.1016/j.nicl.2019.101835. Epub 2019 Apr 22. Neuroimage Clin. 2019. PMID: 31035232 Free PMC article.
-
Magnetic resonance spectroscopic detection of lactate is predictive of a poor prognosis in patients with diffuse intrinsic pontine glioma.Neuro Oncol. 2011 Jul;13(7):791-801. doi: 10.1093/neuonc/nor038. Epub 2011 Jun 8. Neuro Oncol. 2011. PMID: 21653595 Free PMC article.
-
Role of advanced MR imaging modalities in diagnosing cerebral gliomas.Radiol Med. 2009 Apr;114(3):448-60. doi: 10.1007/s11547-008-0351-9. Epub 2008 Dec 11. Radiol Med. 2009. PMID: 19082784 English, Italian.
-
The diagnostic performance of magnetic resonance spectroscopy in differentiating high-from low-grade gliomas: A systematic review and meta-analysis.Eur Radiol. 2016 Aug;26(8):2670-84. doi: 10.1007/s00330-015-4046-z. Epub 2015 Oct 15. Eur Radiol. 2016. PMID: 26471274
References
Publication types
MeSH terms
Substances
LinkOut - more resources
Full Text Sources
Medical