. 2006 Aug 14;174(4):491-7.
doi: 10.1083/jcb.200603069.

Perturbing integrin function inhibits microtubule growth from centrosomes, spindle assembly, and cytokinesis

Affiliations

Perturbing integrin function inhibits microtubule growth from centrosomes, spindle assembly, and cytokinesis

Carlos G Reverte et al. J Cell Biol. .

Abstract

In many mammalian cell types, integrin-mediated cell-matrix adhesion is required for the G1-S transition of the cell cycle. As cells approach mitosis, a dramatic remodeling of their cytoskeleton accompanies dynamic changes in matrix adhesion, suggesting a mechanistic link. However, the role of integrins in cell division remains mostly unexplored. Using two cellular systems, we demonstrate that a point mutation in the beta1 cytoplasmic domain (beta1 tail) known to decrease integrin activity supports entry into mitosis but inhibits the assembly of a radial microtubule array focused at the centrosome during interphase, the formation of a bipolar spindle at mitosis and cytokinesis. These events are restored by externally activating the mutant integrin with specific antibodies. This is the first demonstration that the integrin beta1 tail can regulate centrosome function, the assembly of the mitotic spindle, and cytokinesis.


Figures
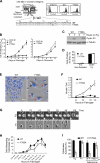
Figure 1.
Figure 1.
Alanine substitution for tyrosine 783 in the β1 tail inhibits cell proliferation by inhibiting cytokinesis. (A) The αIIb-5β3-1 heterodimeric chimeric integrins are depicted with the amino acid sequences of the WT and Y783A mutant β1 tails. Alanine (bold) is substituted for tyrosine 783 (asterisk) within the NPIY motif (underlined). (Inset) analysis of surface expression of chimeric integrin (CD41-FITC signal) in WT and Y783A cells by flow cytometry. CHO K1 cells were used as a negative control. (B) The Y783A mutation inhibits cell proliferation on Fg but not on Fn. CHO K1, WT, and Y783A cells were serum starved for 72 h in F12 and plated on Fg (right) or Fn (left) in CCM1. Samples were assayed by crystal violet staining at the indicated times. Proliferation is plotted as the mean absorbance at 595 nm (A595) ± SD from four independent experiments performed in triplicate. (C and D) CCM1 similarly promotes the G1–S transition in WT and Y783A cells on Fg. Serum-starved cells (time 0) were replated onto Fg in CCM1 as indicated and analyzed for cyclin D1 protein expression (C) and BrdU incorporation (D). (E and F) Growth of Y783A cells on Fg results in binucleation. Serum-starved cells were replated in wells coated with Fg, fixed at the indicated times, DAPI stained, and photographed. (E) Overlaid phase contrast and DAPI images of representative cells at growth day 4. Selected binucleated (red open arrowheads) and multinucleated (black open arrowhead) Y783A cells are indicated. Bar, 20 μm. (F) Plotted is the mean nuclear index calculated as the ratio of the total number of nuclei to the total number of cells (∼100 cells/well) ± SD from three independent experiments. (G) Time-lapse analysis of cytokinesis of representative Y783A cells on Fg or Fn in CCM1. The rounding of cells that occurs early during mitosis was considered time 0. Bar, 25 μm. (H) Y783A cells attempt cytokinesis (scored as the appearance of the cleavage furrow) with similar kinetics as WT cells. Plotted is the mean percentage of attempts at 90-min intervals ± SD from three different fields (∼100 cells/field) in a representative of three independent experiments. (I) Adenovirus-driven expression of the WT β3-1 chimera (Adβ3-1WT) or plating cells on Fn restores cytokinesis. A cytokinesis success was scored as the separation and respreading of daughter cells within 1 h after mitotic rounding. At least 100 cells were analyzed per treatment. Results represent the mean ± SD of three independent experiments.
Figure 2.
Figure 2.
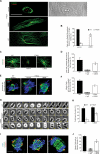
Y783A cells adhered to Fg do not form a normal bipolar spindle at mitosis or a radial MT array focused at the centrosome during interphase. (A) Serum-starved cells were replated on Fg-coated coverslips in CCM1. After 15–18 h, cells were immunostained as indicated. The percentage of WT and Y783A cells with each major phenotype is indicated below a representative image. Images were collected as z series for all three channels, similarly processed and deconvolved to generate 3D images. Results are the mean of three independent experiments (20 cells each) ± SD. Bar, 5 μm. (B) Quantification of bipolar spindles on Fg and Fn at metaphase and anaphase. A z series analysis was performed for each cell to confirm the number of spindle poles. Results are the mean of three independent experiments (25–50 cells each) ± SD. (C) Y783A cells show aberrant contractile rings at anaphase. Cells were also assayed at 18 h for the distribution of α-tubulin, actin, and DNA. Typical WT and Y783A cells at anaphase are shown. Bar, 10 μm. (D) The Y783A mutation inhibits formation of a radial MT network in interphase. Serum-starved cells were replated on Fg in CCM1 for 7 h, fixed, and stained as in C. Bars, 20 μm. (E) Quantification of the presence of a normal MT network at interphase in cells on Fg or Fn. Plotted is the mean ± SD from three independent experiments (100 cells each). (F) The Y783A mutation inhibits MT regrowth. Serum-starved cells were replated on Fg in CCM1, and MT regrowth was assayed at 14 h. At time 0, no MTs were focused on centrosomes (left). At 5 min, >95% of WT cells and <5% of Y783A cells showed MT regrowth (≥400 cells were analyzed). Similar results were obtained in three independent experiments. Images represent the best centrosome-containing plane from deconvolved z series that were similarly processed. Bar, 5 μm.
Figure 3.
Figure 3.
LIBS6 restores the WT phenotype in Y783A cells adhered to Fg in CCM1. (A and B) LIBS6 rescues a normal MT network at interphase. Serum-starved cells were replated on Fg in CCM1 in the presence of 150 ng/ml of either control IgG or LIBS6 for 4 h and then fixed and stained for α- and γ-tubulin. (A) Shown are images of representative cells. Bar, 20 μm. (B) Results are the mean percentage ± SD from three independent experiments (≥100 cells/treatment). (C and E) LIBS6 rescues MT regrowth at interphase and mitosis. Representative cells were imaged as described in Materials and methods. Bar, 5 μm. (D and F) Quantification of the rescue of MT regrowth from interphasic centrosomes and spindle poles. Results represent the mean ± SD from three independent experiments, each including 200 cells at interphase (D) and 25–50 mitotic cells (F). (G) Time-lapse comparison of cytokinesis in a representative WT (top), one of the common Y783A phenotypes in control IgG-treated cells (middle), and a typical rescue in LIBS6-treated Y783A cells (bottom). Cells were serum starved and harvested, and antibodies were added before the cells were replated on Fg. Time-lapse images were collected in 3-min intervals (bottom right on each image). The first image was considered time 0. Bar, 20 μm. (H) Quantification of the rescue of cytokinesis by LIBS6. A successful event was scored as described in Fig. 1 H. Results represent the mean ± SD from three independent experiments (≥50 cells/treatment were analyzed). (I) Rescue of bipolar spindles by LIBS6. Cells were processed as above. At 15–18 h, cells were fixed, stained, and analyzed as described in Fig. 2. Images correspond to representative prometaphase/metaphase and anaphase LIBS6-treated Y783A cells. Bar, 20 μm. (J) Quantification of the rescue of bipolar spindle by LIBS6. Presence of a bipolar spindle was determined as described in Fig. 2 A. Results represent mean ± SD from three independent experiments, each including 25–50 mitotic cells.
Figure 4.
Figure 4.
Effect of activating and inactivating mutations on MT regrowth. CHO K1 cells transiently expressing WT, Y783A, or N780A β1 tails in the context of either αIIb-5β3-1 or αIIb-LΔβ3-1 chimeric integrins were assayed for MT regrowth as described in Materials and methods. (A) Representative images are shown. Bar, 5 μm. (B) Quantification of MT regrowth. Results represent the mean ± SD from three independent experiments (≥300 cells/treatment).
Figure 5.
Figure 5.
Expression of the Y783A mutation in the context of the full-length human β1 subunit in β1-null GD25 cells. (A) WT and Y783A β1 are expressed at similar levels in stable transfectants as assayed by flow cytometry using mAb K20. (B and C) Inhibition and rescue of MT assembly in GD25 h-β1Y783A cells. MT regrowth was assayed in CCM1 ± TS2/16 (10 μg/ml). (B) Representative images are shown. (C) Plotted is mean ± range from two independent experiments (≥200 cells/treatment). (D and E) Inhibition and rescue of bipolar spindle formation. GD25 h-β1Y783A cells proliferating in serum-containing medium were arrested in mitosis with nocodazole and replated on Lm-coated coverslips in CCM1. At 30–45 min, cells were fixed and processed for spindle analysis. (D) Shown are representative images of WT and Y783A ± TS2/16. (E) Results represent the mean ± range from two independent experiments (≥25 cells/treatment). Bar, 5 μm.

References

    1. Assoian, R.K., and M.A. Schwartz. 2001. Coordinate signaling by integrins and receptor tyrosine kinases in the regulation of G1 phase cell-cycle progression. Curr. Opin. Genet. Dev. 11:48–53. - PubMed
    1. Aszodi, A., E.B. Hunziker, C. Brakebusch, and R. Fässler. 2003. Beta1 integrins regulate chondrocyte rotation, G1 progression, and cytokinesis. Genes Dev. 17:2465–2479. - PMC - PubMed
    1. Ben-Ze'ev, A., and A. Raz. 1981. Multinucleation and inhibition of cytokinesis in suspended cells: reversal upon reattachment to a substrate. Cell. 26:107–115. - PubMed
    1. Bodeau, A.L., A.L. Berrier, A.M. Mastrangelo, R. Martinez, and S.E. LaFlamme. 2001. A functional comparison of mutations in integrin beta cytoplasmic domains: effects on the regulation of tryosine phosphorylation, cell spreading, cell attachment and beta1 integrin conformation. J. Cell Sci. 114:2795–2807. - PubMed
    1. Doxsey, S. 2001. Re-evaluating centrosome function. Nat. Rev. Mol. Cell Biol. 2:688–698. - PubMed

Publication types

MeSH terms