. 2006 Sep;7(9):749-56.
doi: 10.1631/jzus.2006.B0749.

Edaravone protects PC12 cells from ischemic-like injury via attenuating the damage to mitochondria

Affiliations

Edaravone protects PC12 cells from ischemic-like injury via attenuating the damage to mitochondria

Ying Song et al. J Zhejiang Univ Sci B. 2006 Sep.

Abstract

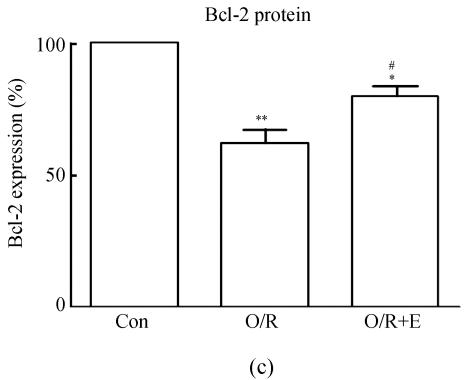
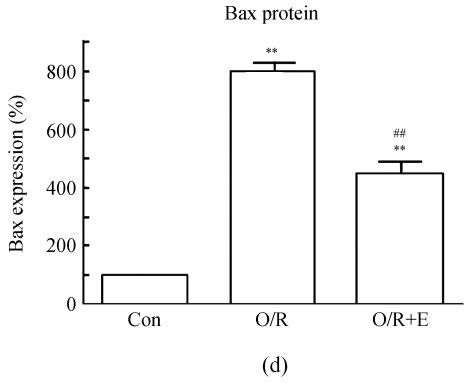
Background: Edaravone had been validated to effectively protect against ischemic injuries. In this study, we investigated the protective effect of edaravone by observing the effects on anti-apoptosis, regulation of Bcl-2/Bax protein expression and recovering from damage to mitochondria after OGD (oxygen-glucose deprivation)-reperfusion.

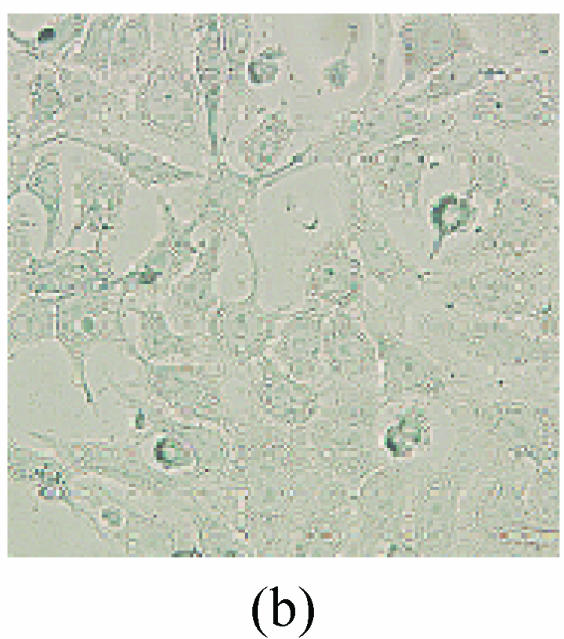
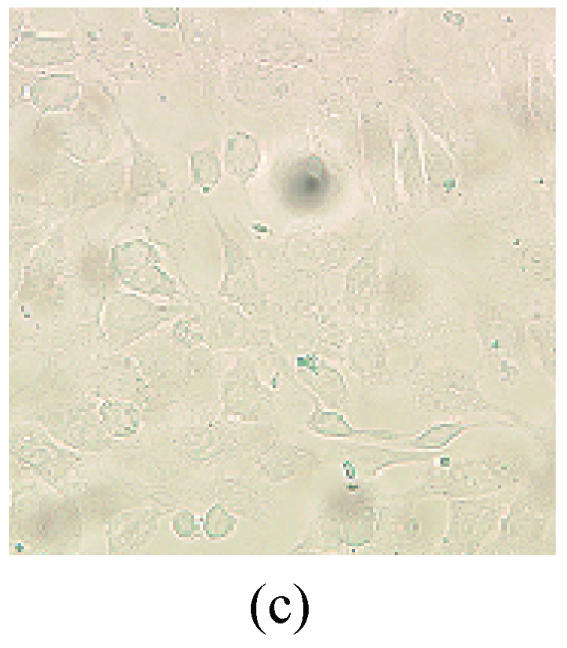
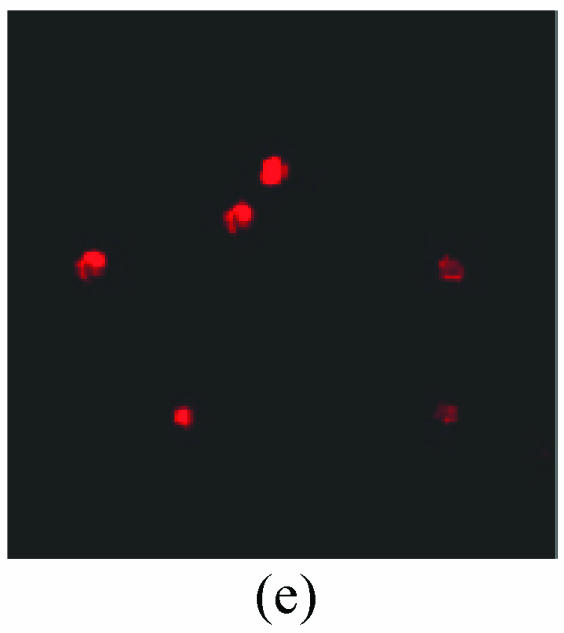
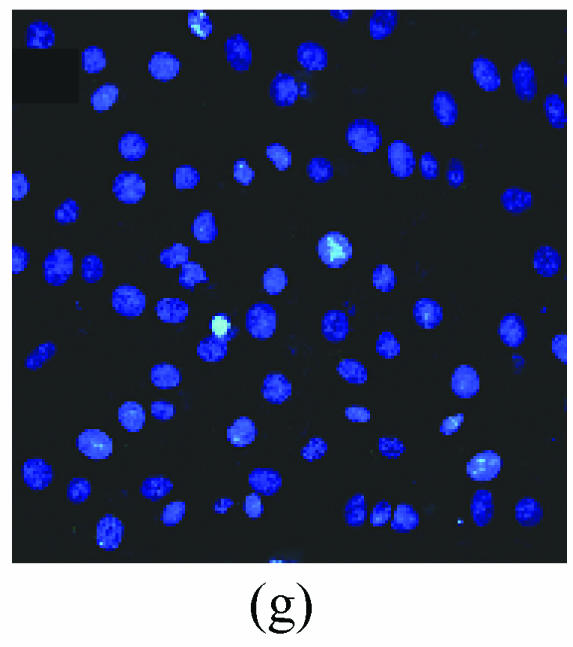
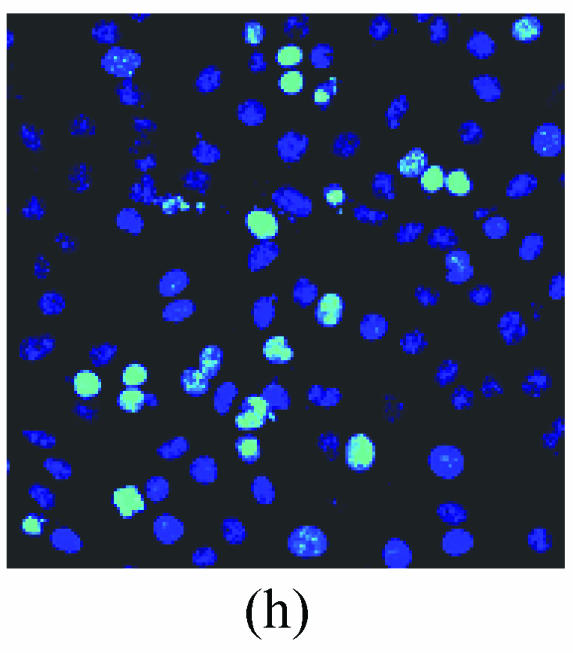
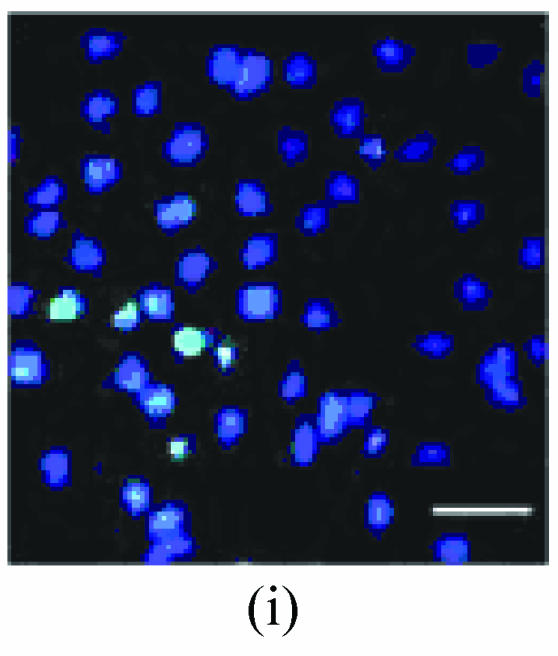
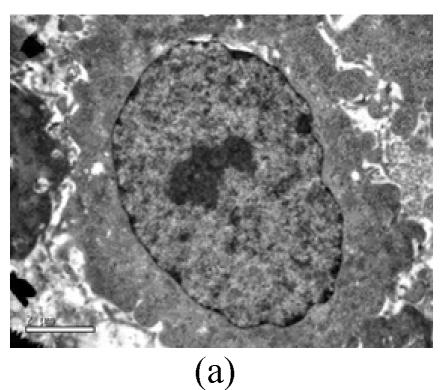
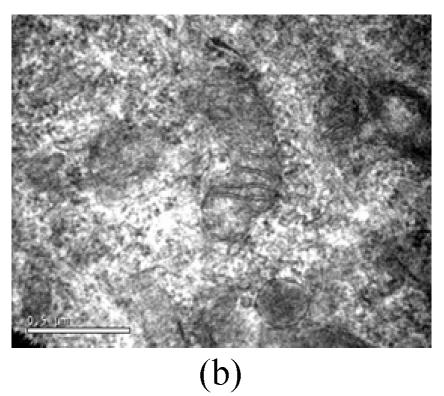
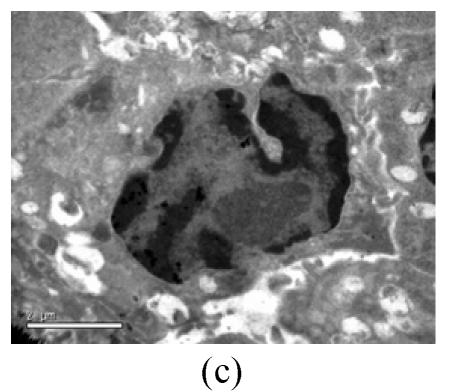
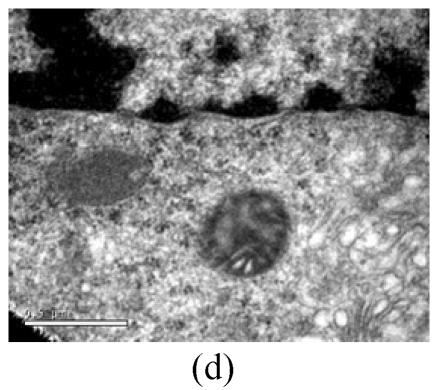
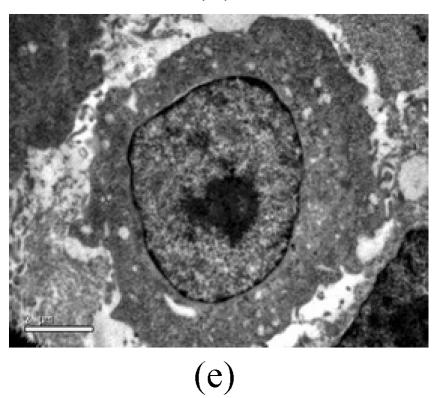
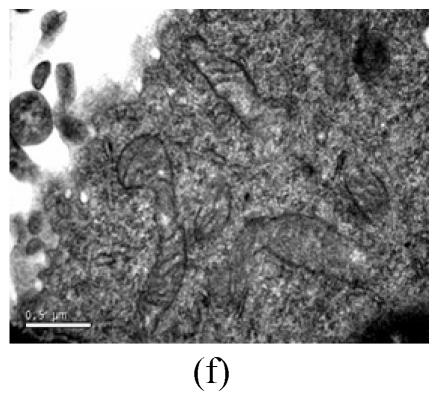
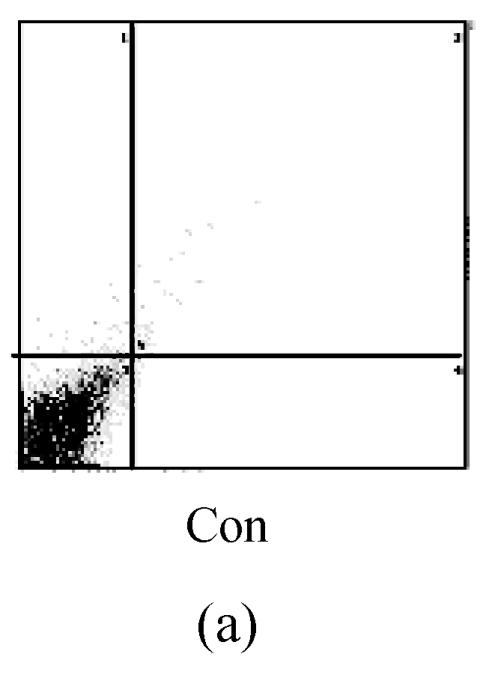
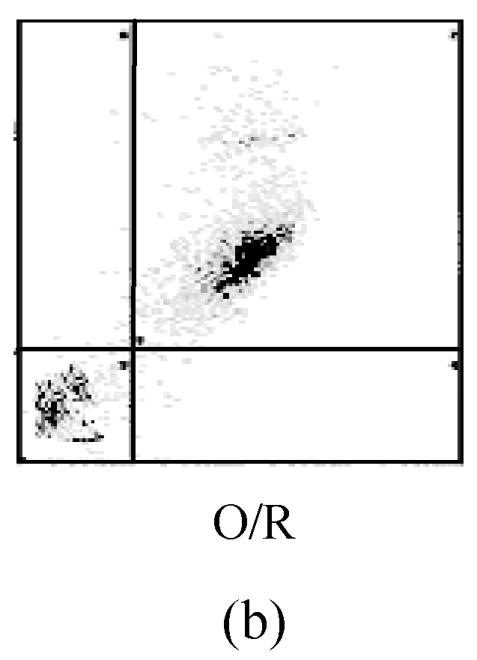
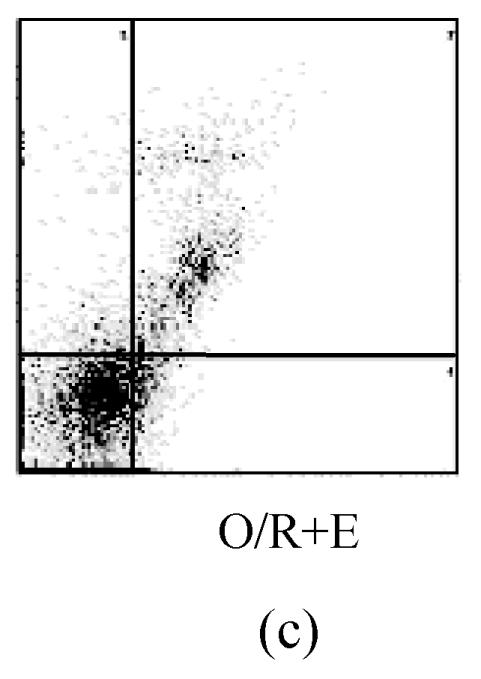
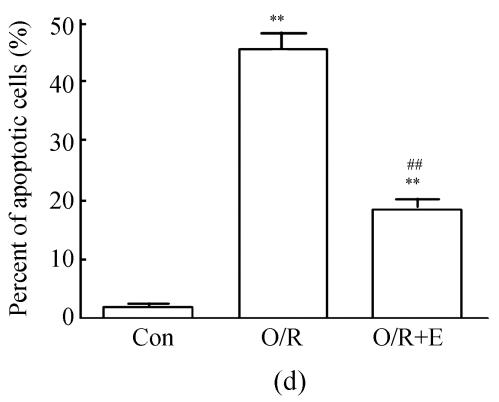
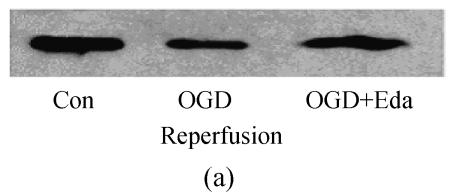
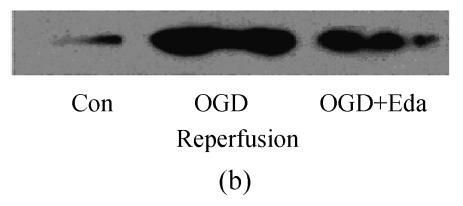
Methods: Viability of PC12 cells which were injured at different time of OGD injury, was quantified by measuring MTT (2-(4,5-dimethylthia-zol-2-yl)-2,5-diphenyltetrazolium bromide) staining. In addition, PC12 cells' viability was also quantified after their preincubation in different concentration of edaravone for 30 min followed by (OGD). Furthermore, apoptotic population of PC12 cells that reinsulted from OGD-reperfusion with or without preincubation with edaravone was determined by flow cytometer analysis, electron microscope and Hoechst/PI staining. Finally, change of Bcl-2/Bax protein expression was detected by Western blot.

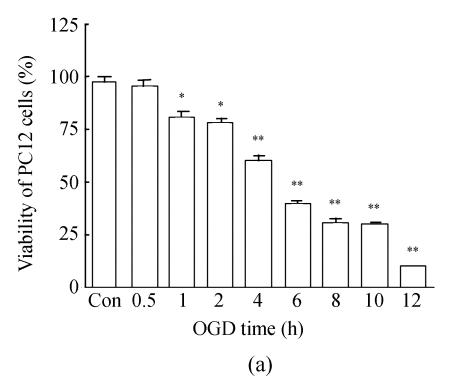
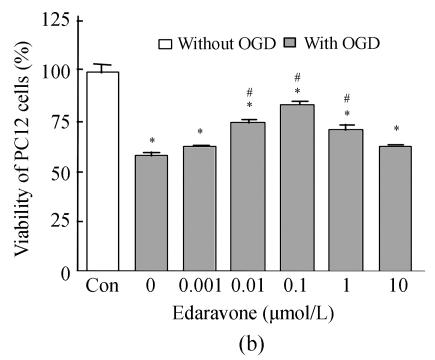
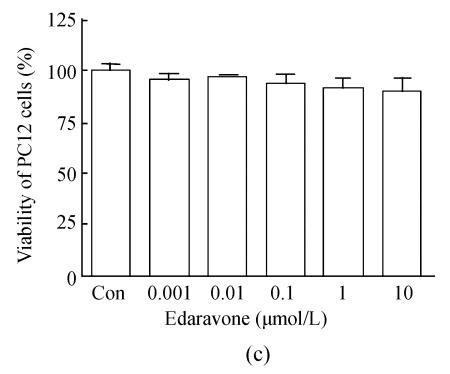
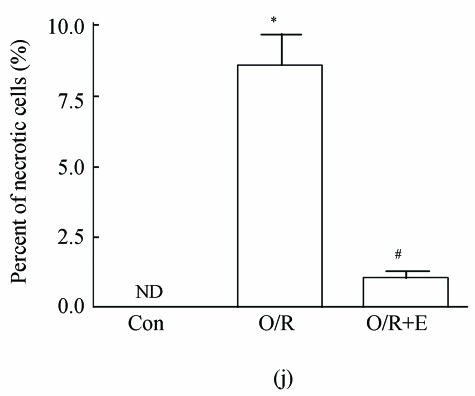
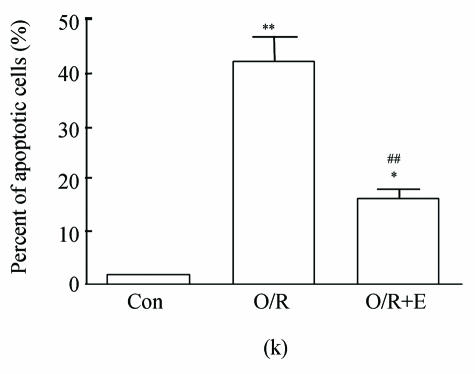
Results: (1) The viability of PC12 cells decreased with time (1 - 12 h) after OGD. We regarded the model of OGD 2 h, then replacing DMEM (Dulbecco's Modified Eagle's Medium) for another 24 h as an OGD-reperfusion in this research. Furthermore, most PC12 cells were in the state of apoptosis after OGD-reperfusion. (2) The viability of PC12 cells preincubated with edaravone at high concentrations (1, 0.1, 0.01 micromol/L) increased significantly with edaravone protecting PC12 cells from apoptosis after OGD-reperfusion injury. (3) Furthermore, edaravone attenuates the damage of OGD-reperfusion on mitochondria and regulated Bcl-2/Bax protein imbalance expression after OGD-reperfusion.

Conclusion: Neuroprotective effects of edaravone on ischemic or other brain injuries may be partly mediated through inhibition of Bcl-2/Bax apoptotic pathways by recovering from the damage of mitochondria.


Figures

Fig. 1
Fig. 1
Time-dependent damage of OGD-reperfusion on PC12 cells and edaravone protective effect on OGD-reperfusion. (a) OGD reduced the cell viability in time-dependent; (b) Edaravone protected PC12 cells from OGD-reperfusion in a concentration-dependent manner; (c) Edaravone did not show any toxin on PC12 cells Data are expressed as mean±SD; n=12 wells for each group; * P<0.05 and ** P<0.01, compared to control; # P<0.05, compared to OGD-reperfusion (one-way ANOVA)
Fig. 1
Fig. 1
Time-dependent damage of OGD-reperfusion on PC12 cells and edaravone protective effect on OGD-reperfusion. (a) OGD reduced the cell viability in time-dependent; (b) Edaravone protected PC12 cells from OGD-reperfusion in a concentration-dependent manner; (c) Edaravone did not show any toxin on PC12 cells Data are expressed as mean±SD; n=12 wells for each group; * P<0.05 and ** P<0.01, compared to control; # P<0.05, compared to OGD-reperfusion (one-way ANOVA)
Fig. 2
Fig. 2
The protective effects of edaravone on OGD-reperfusion induced PC12 cell death by Hoechst 33258/PI staining. The cell death was analyzed by double fluorescent staining with Hoechst 33258 and propidium iodide (PI). (a) Con, (b) O/R, (c) O/R+E: Under microscopes; (d) Con, (e) O/R, (f) O/R+E: The representative microphotographs show the necrotic cells as detected by PI staining after OGD-reperfusion induced injury; (g) Con, (h) O/R, (i) O/R+E: The representative microphotographs show the apoptotic cells as detected by Hoechst 33258 staining after OGD-reperfusion induced. However, edaravone (0.1 μmol/L) prevented PC12 cells from OGD-reperfusion injury; (j)~(k) The summarized data show percentage changes in the numbers of necrotic (j) and apoptotic (k) cells Data are expressed as mean±SD; n=4 wells for each group; * P<0.05 and ** P<0.01, compared to control; # P<0.05 and ## P<0.01, compared to OGD alone (one-way ANOVA). Con: Control; O/R: OGD 2 h and reperfusion 24 h; O/R+E=OGD-reperfusion+edaravone (0.1 μmol/L). Scale bar=20 μm
Fig. 2
Fig. 2
The protective effects of edaravone on OGD-reperfusion induced PC12 cell death by Hoechst 33258/PI staining. The cell death was analyzed by double fluorescent staining with Hoechst 33258 and propidium iodide (PI). (a) Con, (b) O/R, (c) O/R+E: Under microscopes; (d) Con, (e) O/R, (f) O/R+E: The representative microphotographs show the necrotic cells as detected by PI staining after OGD-reperfusion induced injury; (g) Con, (h) O/R, (i) O/R+E: The representative microphotographs show the apoptotic cells as detected by Hoechst 33258 staining after OGD-reperfusion induced. However, edaravone (0.1 μmol/L) prevented PC12 cells from OGD-reperfusion injury; (j)~(k) The summarized data show percentage changes in the numbers of necrotic (j) and apoptotic (k) cells Data are expressed as mean±SD; n=4 wells for each group; * P<0.05 and ** P<0.01, compared to control; # P<0.05 and ## P<0.01, compared to OGD alone (one-way ANOVA). Con: Control; O/R: OGD 2 h and reperfusion 24 h; O/R+E=OGD-reperfusion+edaravone (0.1 μmol/L). Scale bar=20 μm
Fig. 3
Fig. 3
Effects of edaravone on OGD-reperfusion by electron microscope. (a) Normal feature of PC12 cells showed clear intact nuclear; (b) Normal mitochondria of PC12 cells; (c) After OGD-reperfusion insult, PC12 cell’s nuclear’s heterochromatin condensed and congregated to nuclear’s membranes; (d) After OGD-reperfusion insult, PC12 cell’s mitochondria’s condensed and its matrix disappeared; (e) If preincubated with edaravone (0.1 μmol/L), PC12 cells maintained normal nuclear’s morphology; (f) If preincubated with edaravone (0.1 μmol/L), PC12 cells maintained normal mitochondria’s morphology. Bar=0.5 μm
Fig. 3
Fig. 3
Effects of edaravone on OGD-reperfusion by electron microscope. (a) Normal feature of PC12 cells showed clear intact nuclear; (b) Normal mitochondria of PC12 cells; (c) After OGD-reperfusion insult, PC12 cell’s nuclear’s heterochromatin condensed and congregated to nuclear’s membranes; (d) After OGD-reperfusion insult, PC12 cell’s mitochondria’s condensed and its matrix disappeared; (e) If preincubated with edaravone (0.1 μmol/L), PC12 cells maintained normal nuclear’s morphology; (f) If preincubated with edaravone (0.1 μmol/L), PC12 cells maintained normal mitochondria’s morphology. Bar=0.5 μm
Fig. 4
Fig. 4
Effects of edaravone on OGD-reperfusion by flow cytometer. (a)~(c) The representative figure show the apoptotic cells as detected by flow cytometer after OGD-induced injury; (d) The summarized data show apoptotic cells’ percentage changes by flow cytometer Data are expressed as mean±SD; n=4 wells for each group; ** P<0.01, compared to control; ## P<0.01, compared to OGD-reperfusion alone (one-way ANOVA). Con: Control; O/R: OGD 2 h and reperfusion 24 h; O/R+E=OGD-reperfusion+edaravone (0.1 μmol/L)
Fig. 4
Fig. 4
Effects of edaravone on OGD-reperfusion by flow cytometer. (a)~(c) The representative figure show the apoptotic cells as detected by flow cytometer after OGD-induced injury; (d) The summarized data show apoptotic cells’ percentage changes by flow cytometer Data are expressed as mean±SD; n=4 wells for each group; ** P<0.01, compared to control; ## P<0.01, compared to OGD-reperfusion alone (one-way ANOVA). Con: Control; O/R: OGD 2 h and reperfusion 24 h; O/R+E=OGD-reperfusion+edaravone (0.1 μmol/L)
Fig. 5
Fig. 5
Effects of edaravone on Bcl-2/Bax protein expression after OGD-reperfusion by Western blot analysis. (a)~(b) The representative photographs showing the Bcl-2 (a)/Bax (b) protein as detected by Western blot after OGD-induced injury; (c)~(d) The summarized data showing Bcl-2 (c)/Bax (d) protein expression percentage changes by Western blot Data are expressed as mean±SD; n=3 for each group; * P<0.05 and ** P<0.01, compared to control; # P<0.05 and ## P<0.01, compared to OGD-reperfusion alone (one-way ANOVA). Con: Control; O/R: OGD 2 h and reperfusion 24 h; O/R+E=OGD-reperfusion+edaravone (0.1 μmol/L)
Fig. 5
Fig. 5
Effects of edaravone on Bcl-2/Bax protein expression after OGD-reperfusion by Western blot analysis. (a)~(b) The representative photographs showing the Bcl-2 (a)/Bax (b) protein as detected by Western blot after OGD-induced injury; (c)~(d) The summarized data showing Bcl-2 (c)/Bax (d) protein expression percentage changes by Western blot Data are expressed as mean±SD; n=3 for each group; * P<0.05 and ** P<0.01, compared to control; # P<0.05 and ## P<0.01, compared to OGD-reperfusion alone (one-way ANOVA). Con: Control; O/R: OGD 2 h and reperfusion 24 h; O/R+E=OGD-reperfusion+edaravone (0.1 μmol/L)

Similar articles

Cited by

References

    1. Amemiya S, Kamiya T, Nito C, Inaba T, Kato K, Ueda M, Shimazaki K, Katayama Y. Anti-apoptotic and neuroprotective effects of edaravone following transient focal ischemia in rats. Eur J Pharmacol. 2005;516(2):125–130. doi: 10.1016/j.ejphar.2005.04.036. - DOI - PubMed
    1. Caccamo D, Campisi A, Curro M, Li VG, Vanella A, Ientile R. Excitotoxic and post-ischemic neurodegeneration: involvement of transglutaminases. Amino Acids. 2004;27(3-4):373–379. doi: 10.1007/s00726-004-0117-1. - DOI - PubMed
    1. Ceccatelli S, Tamm C, Sleeper E, Orrenius S. Neural stem cells and cell death. Toxicol Lett. 2004;149(1-3):59–66. doi: 10.1016/j.toxlet.2003.12.060. - DOI - PubMed
    1. Christophe M, Nicolas S. Mitochondria: a target for neuroprotective interventions in cerebral ischemia-reperfusion. Curr Pharm Des. 2006;12(6):739–757. doi: 10.2174/138161206775474242. - DOI - PubMed
    1. Chung TW, Koo BS, Choi EG, Kim MG, Lee IS, Kim CH. Neuroprotective effect of a chuk-me-sun-dan on neurons from ischemic damage and neuronal cell toxicity. Neurochem Res. 2006;31(1):1–9. doi: 10.1007/s11064-005-9264-3. - DOI - PubMed

Publication types