

Quantification of damage in DNA recovered from highly degraded samples--a case study on DNA in faeces
- PMID: 16911807
- PMCID: PMC1564134
- DOI: 10.1186/1742-9994-3-11
Quantification of damage in DNA recovered from highly degraded samples--a case study on DNA in faeces
Abstract
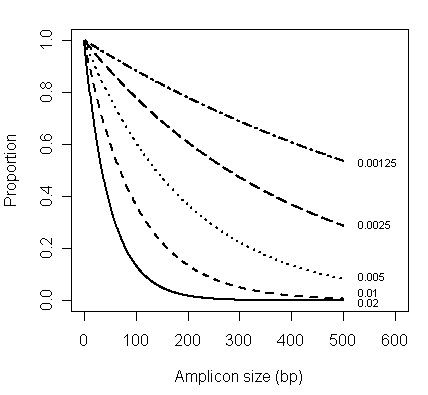
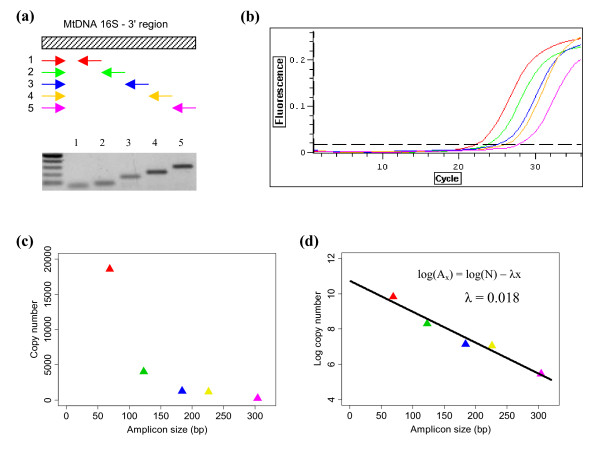
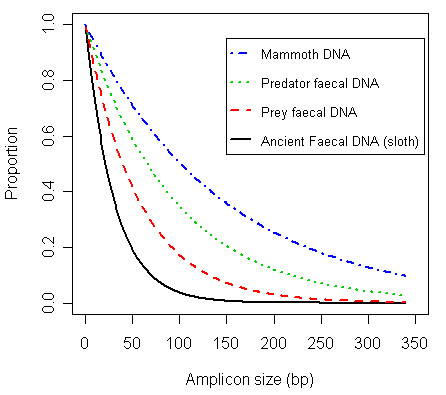
Background: Poorly preserved biological tissues have become an important source of DNA for a wide range of zoological studies. Measuring the quality of DNA obtained from these samples is often desired; however, there are no widely used techniques available for quantifying damage in highly degraded DNA samples. We present a general method that can be used to determine the frequency of polymerase blocking DNA damage in specific gene-regions in such samples. The approach uses quantitative PCR to measure the amount of DNA present at several fragment sizes within a sample. According to a model of random degradation the amount of available template will decline exponentially with increasing fragment size in damaged samples, and the frequency of DNA damage (lambda) can be estimated by determining the rate of decline.
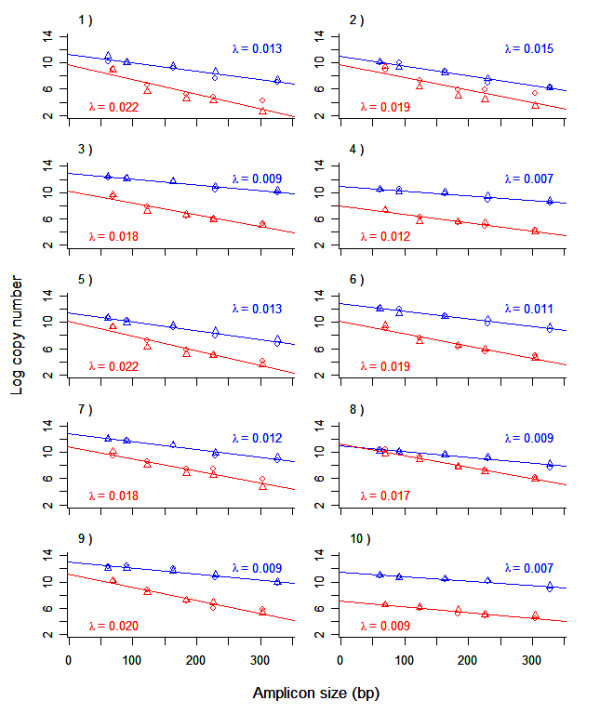
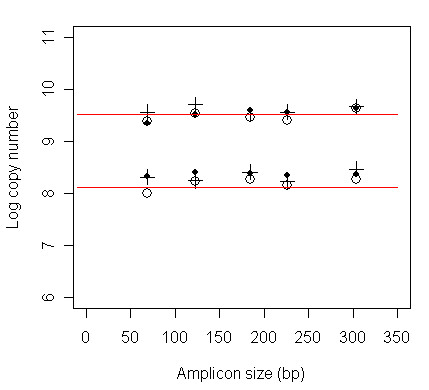
Results: The method is illustrated through the analysis of DNA extracted from sea lion faecal samples. Faeces contain a complex mixture of DNA from several sources and different components are expected to be differentially degraded. We estimated the frequency of DNA damage in both predator and prey DNA within individual faecal samples. The distribution of fragment lengths for each target fit well with the assumption of a random degradation process and, in keeping with our expectations, the estimated frequency of damage was always less in predator DNA than in prey DNA within the same sample (mean lambda(predator) = 0.0106 per nucleotide; mean lambda(prey) = 0.0176 per nucleotide). This study is the first to explicitly define the amount of template damage in any DNA extracted from faeces and the first to quantify the amount of predator and prey DNA present within individual faecal samples.
Conclusion: We present an approach for characterizing mixed, highly degraded PCR templates such as those often encountered in ecological studies using non-invasive samples as a source of DNA, wildlife forensics investigations and ancient DNA research. This method will allow researchers to measure template quality in order to evaluate alternate sources of DNA, different methods of sample preservation and different DNA extraction protocols. The technique could also be applied to study the process of DNA decay.
Figures
References
-
- Withler RE, Candy JR, Beacham TD, Miller KM. Forensic DNA analysis of Pacific salmonid samples for species and stock identification. Environ Biol Fishes. 2004;69:275–285. doi: 10.1023/B:EBFI.0000022901.26754.0b. - DOI
-
- Glenn TC, Stephan W, Braun MJ. Effects of a population bottleneck on Whooping Crane mitochondrial DNA variation. Conserv Biol. 1999;13:1097–1107. doi: 10.1046/j.1523-1739.1999.97527.x. - DOI
-
- Shapiro B, Drummond AJ, Rambaut A, Wilson MC, Matheus PE, Sher AV, Pybus OG, Gilbert MTP, Barnes I, Binladen J, Willerslev E, Hansen AJ, Baryshnikov GF, Burns JA, Davydov S, Driver JC, Froese DG, Harington CR, Keddie G, Kosintsev P, Kunz ML, Martin LD, Stephenson RO, Storer J, Tedford R, Zimov S, Cooper A. Rise and fall of the Beringian steppe bison. Science. 2004;306:1561–1565. doi: 10.1126/science.1101074. - DOI - PubMed
LinkOut - more resources
Full Text Sources
