. 2006 Aug 22;103(34):12741-6.
doi: 10.1073/pnas.0605457103. Epub 2006 Aug 15.

Identification of inflammatory gene modules based on variations of human endothelial cell responses to oxidized lipids

Affiliations

Identification of inflammatory gene modules based on variations of human endothelial cell responses to oxidized lipids

Peter S Gargalovic et al. Proc Natl Acad Sci U S A. .

Abstract

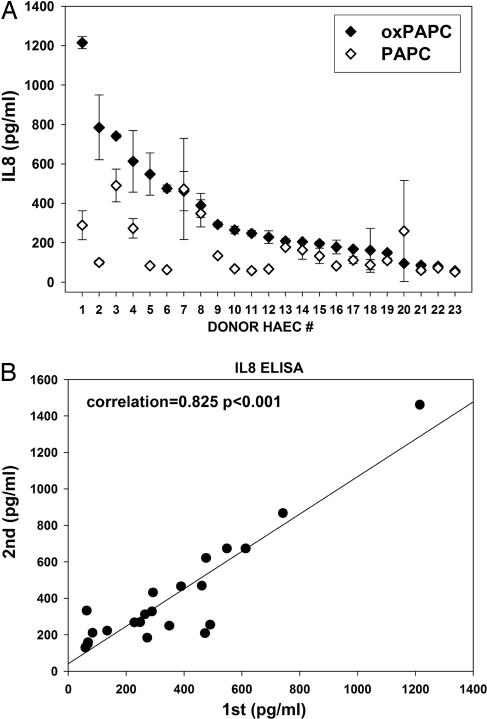
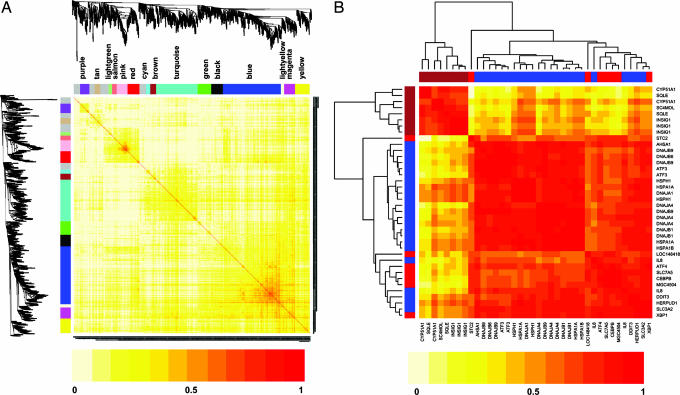
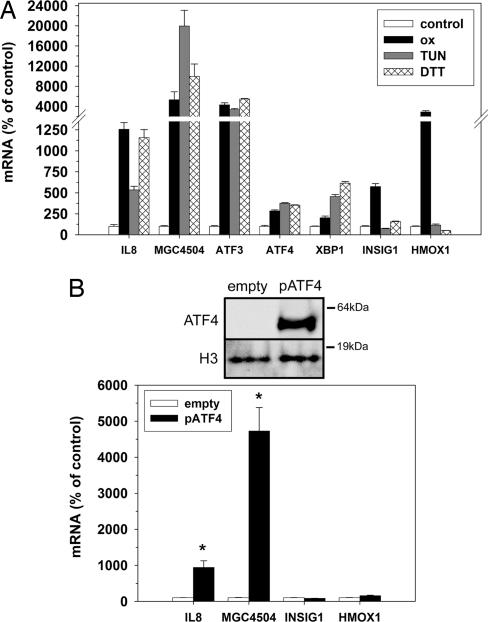
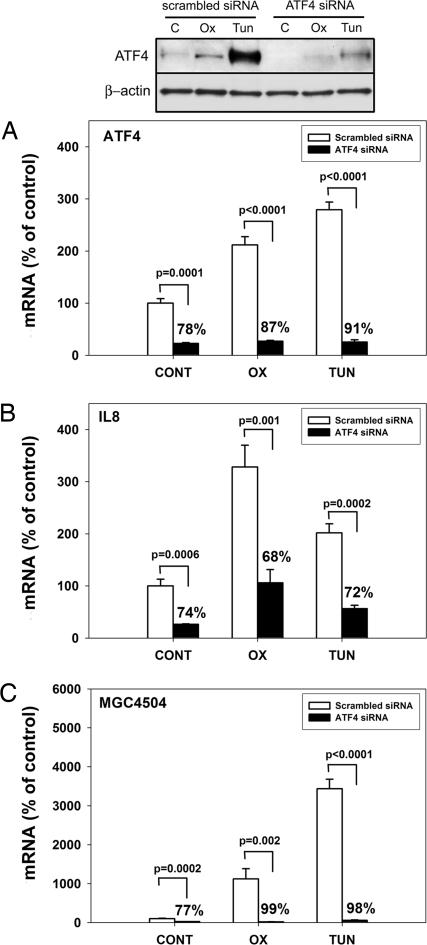
Oxidized phospholipids are thought to promote atherogenesis by stimulating endothelial cells (ECs) to produce inflammatory cytokines, such as IL-8. In studies with mouse models, we previously demonstrated that genetic variation in inflammatory responses of endothelial cells to oxidized lipids contributes importantly to atherosclerosis susceptibility. We now show that similar variations occur in cultured aortic ECs derived from multiple heart transplant donors. These variations were stably maintained between passages and, thus, reflect either genetic or epigenetic regulatory differences. Expression array analysis of aortic EC cultures derived from 12 individuals revealed that >1,000 genes were regulated by oxidized phospholipids. We have used the observed variations in the sampled population to construct a gene coexpression network comprised of 15 modules of highly connected genes. We show that several identified modules are significantly enriched in genes for known pathways and confirm a module enriched for unfolded protein response (UPR) genes using siRNA and the UPR inducer tunicamycin. On the basis of the constructed network, we predicted that a gene of unknown function (MGC4504) present in the UPR module is a target for UPR transcriptional activator ATF4. Our data also indicate that IL-8 is present in the UPR module and is regulated, in part, by the UPR. We validate these by using siRNA. In conclusion, we show that interindividual variability can be used to group genes into pathways and predict gene-gene regulatory relationships, thus identifying targets potentially involved in susceptibility to common diseases such as atherosclerosis.


Conflict of interest statement

Conflict of interest statement: W.-P.Y., A.H., A.T., and T.G.K. are employees of Bristol–Myers Squibb Pharmaceutical Research Institute.

Figures

Fig. 1.
Fig. 1.
Primary human aortic endothelial cells isolated from different donors exhibit differences in IL-8 induction in response to oxPAPC treatment. (A) HAEC lines derived from human individuals were examined for IL-8 induction in response to oxPAPC or control PAPC by ELISA. Individual HAEC lines from 23 donors were treated with oxPAPC (40 μg/ml) or PAPC (40 μg/ml) for 4 h, media were collected, and IL-8 levels were analyzed by ELISA. Absolute levels of secreted IL-8 protein (picograms per milliliter) after the treatment were plotted for each individual HAEC line. HAEC donors were numbered according to the level of IL-8 induction in response to oxPAPC. (B) Eleven individual HAEC cell lines were examined for differences in IL-8 protein secretion between successive cell passages. HAECs were treated with oxPAPC (40 μg/ml) or PAPC (40 μg/ml) for 4 h, and IL-8 protein was measured by ELISA (first passage). The same analysis was performed after freezing and replating cells to obtain the subsequent cell passage (second passage).
Fig. 2.
Fig. 2.
Gene coexpression network of the 1,043 genes regulated by oxPAPC. (A) Pearson correlations between expression profiles of all pairs of genes were transformed into network connection strengths (denoted by intensity of red color) by using a power function (see Materials and Methods). Average linkage hierarchical clustering with the topological overlap dissimilarity measure was used to identify gene coexpression modules, each of which was assigned a unique color. Rows and columns are symmetric and represent genes. (B) A color-coded version of the correlation matrix (Table 4) involving the SREBP genes from the brown module and the UPR genes from blue and red modules. The intensity of red color represents the absolute value of Pearson correlation coefficients. The rows and columns have been sorted by the gene clustering tree. Note that there are two broad clusters corresponding to SREBP and UPR genes.
Fig. 3.
Fig. 3.
UPR regulates expression of IL-8 and MGC4504. (A) Effect of UPR inducers on gene expression. HAECs were treated for 4 h in medium alone (control), medium containing oxPAPC (50 μg/ml), or UPR-inducing agents tunicamycin (10 μg/ml) or DTT (1 mM). Expression levels of IL-8 (blue module), MGC4504 (red module), INSIG1 (brown module), HMOX1 (yellow module), and UPR genes from blue and red module (ATF3, ATF4, and XBP1) were measured by quantitative PCR (Q-PCR) as described in Materials and Methods. Q-PCR results are expressed as the mean differences for each treatment group and control group (set at 100%) ± 1 SD. (B) Effect of ATF4 overexpression on IL-8 and MGC4504. HeLa cells were transfected with an expression plasmid for human ATF4 (pATF4) or a control plasmid (empty) as described in Materials and Methods. Forty-eight hours after transfection, expression levels of IL-8, MGC4504, INSIG1, and HMOX1 mRNA were analyzed by Q-PCR. ATF4 protein levels in isolated nuclear extracts were measured by immunoblotting. Histone H3 (H3) antibody was used as a protein-loading control. Asterisks indicate significantly different mean expression value of pATF4 group from control group (P < 0.005).
Fig. 4.
Fig. 4.
Effect of the ATF4 siRNA on IL-8 and MGC4504 expression. HAECs were transfected with siRNA directed against human ATF4 or with control scrambled oligonucleotide (see Materials and Methods). Transfected cells were treated for 4 h with medium only (control), oxPAPC (50 μg/ml), or tunicamycin (10 μg/ml). mRNA expression levels of ATF4 (A), IL-8 (B), and MGC4504 (C) were measured by Q-PCR. The levels of ATF4 protein were measured in isolated nuclear extracts by immunoblotting (A). Q-PCR data were set at 100% for untreated cells (control) incubated with scrambled siRNA. Percentage values above bars indicate the mean expression decrease in the ATF4 siRNA group versus control siRNA group for each treatment ± 1 SD.

References

    1. Libby P. Nature. 2002;420:868–874. - PubMed
    1. Lusis A. J., Mar R., Pajukanta P. Annu. Rev. Genomics Hum. Genet. 2004;5:189–218. - PubMed
    1. Berliner J. A., Watson A. D. N. Engl. J. Med. 2005;353:9–11. - PubMed
    1. Shi W., Haberland M. E., Jien M. L., Shih D. M., Lusis A. J. Circulation. 2000;102:75–81. - PubMed
    1. Shi W., Wang N. J., Shih D. M., Sun V. Z., Wang X., Lusis A. J. Circ. Res. 2000;86:1078–1084. - PubMed

Publication types