. 2006 Aug 15;20(16):2266-78.
doi: 10.1101/gad.1450606.

The Forkhead transcription factor Hcm1 regulates chromosome segregation genes and fills the S-phase gap in the transcriptional circuitry of the cell cycle

Affiliations

The Forkhead transcription factor Hcm1 regulates chromosome segregation genes and fills the S-phase gap in the transcriptional circuitry of the cell cycle

Tata Pramila et al. Genes Dev. .

Abstract

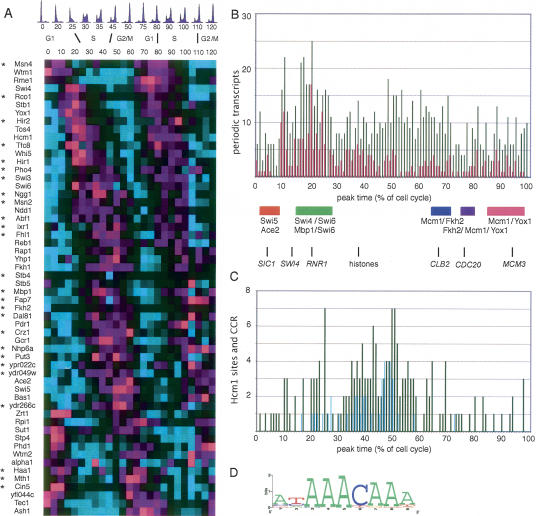
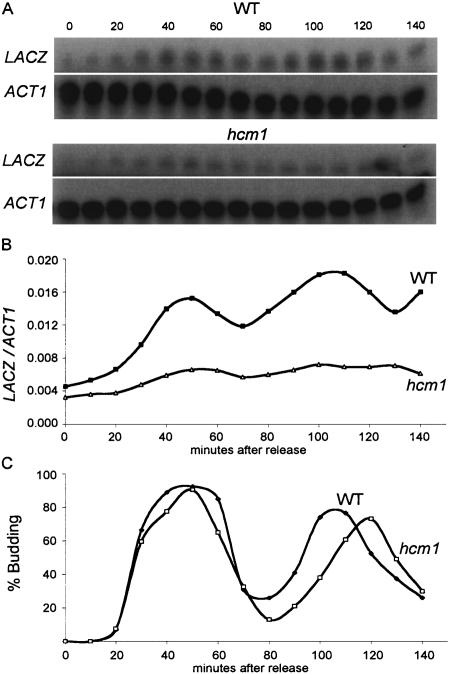
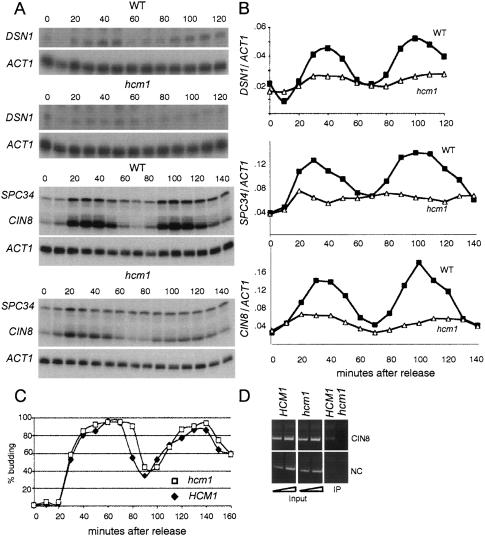
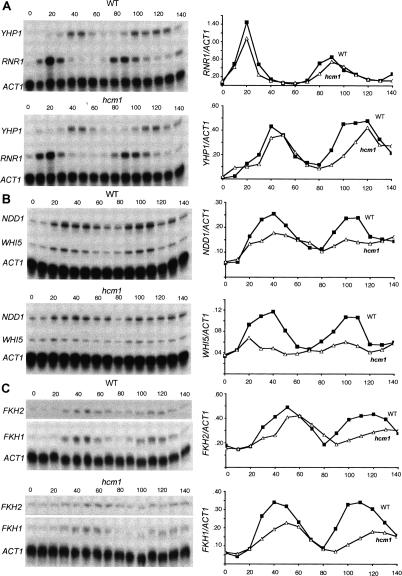
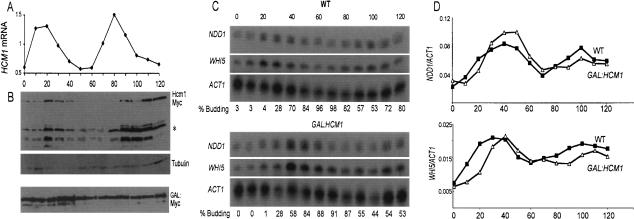
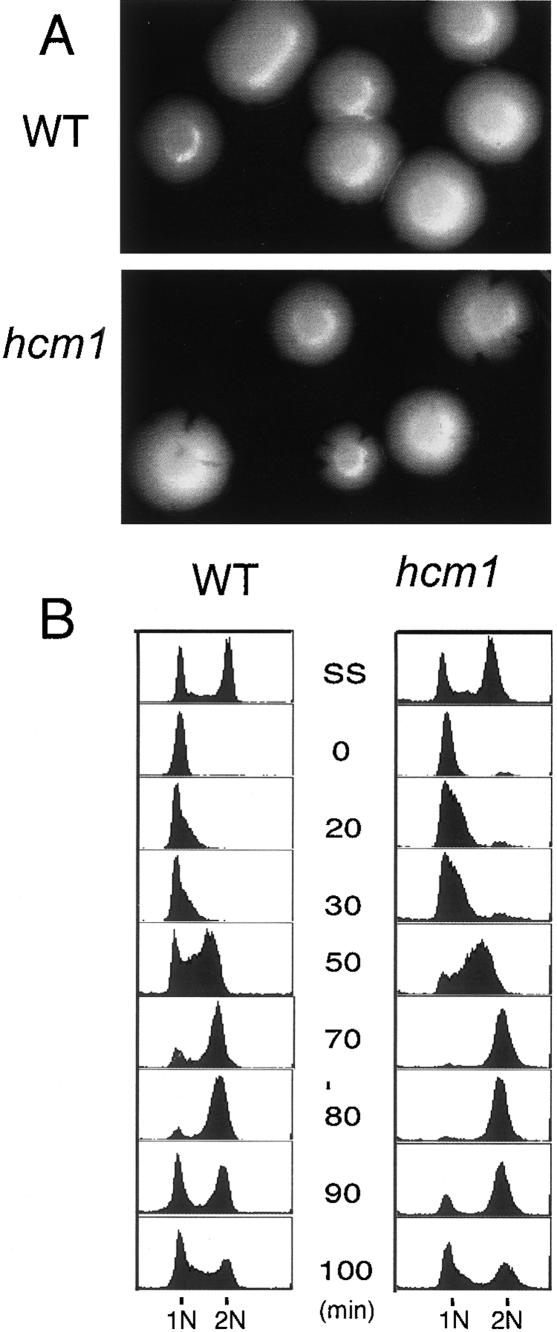
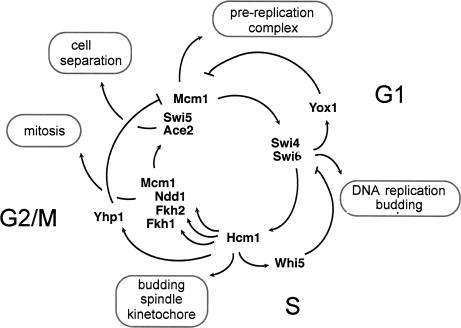
Transcription patterns shift dramatically as cells transit from one phase of the cell cycle to another. To better define this transcriptional circuitry, we collected new microarray data across the cell cycle of budding yeast. The combined analysis of these data with three other cell cycle data sets identifies hundreds of new highly periodic transcripts and provides a weighted average peak time for each transcript. Using these data and phylogenetic comparisons of promoter sequences, we have identified a late S-phase-specific promoter element. This element is the binding site for the forkhead protein Hcm1, which is required for its cell cycle-specific activity. Among the cell cycle-regulated genes that contain conserved Hcm1-binding sites, there is a significant enrichment of genes involved in chromosome segregation, spindle dynamics, and budding. This may explain why Hcm1 mutants show 10-fold elevated rates of chromosome loss and require the spindle checkpoint for viability. Hcm1 also induces the M-phase-specific transcription factors FKH1, FKH2, and NDD1, and two cell cycle-specific transcriptional repressors, WHI5 and YHP1. As such, Hcm1 fills a significant gap in our understanding of the transcriptional circuitry that underlies the cell cycle.


Figures

Figure 1.
Figure 1.
Periodic transcription during the S. cerevisiae cell cycle. (A) Heat map of α30 microarray data through two cell cycles showing 57 TFs that have been identified as being periodic by PNM5 or PBM5 analysis. Asterisks indicate transcripts not previously viewed as periodic. Names of the TF corresponding to each row are listed on the left, while each time point is represented by a column. The peak transcript level is magenta, troughs are cyan, and black represents no change compared with an asynchronous culture. The progress of the cell cycle in these cells, as monitored by FACS, is indicated at the top. (B) Histogram showing the distribution of the average peak expression times of the top 1000 periodic genes from PBM5 as a percent of the cell cycle, with zero time defined as the M/G1 transition (de Lichtenberg et al. 2005b). The top 300 ranked genes are indicated in magenta. Histones serve as a landmark of S phase and peak at 37%. TFs active during specific phases are indicated below. (C) Average peak expression times of 180 potential Hcm1 target genes. The distribution of the 40 HCM1 targets identified in the initial PhyME result are in cyan. (D) WebLogo (Crooks et al. 2004) for the consensus Hcm1-binding site used to search the genome for conserved Hcm1 target genes.
Figure 2.
Figure 2.
Cell cycle regulation by the HCM element. (A) S1 transcript analysis of LacZ mRNA from a LacZ reporter containing the HCM sites from WHI5 in wild-type (WT) and hcm1 cells. (B) Quantitation of the gels in A, showing the loss of cell cycle periodicity in hcm1 cells. (C) Budding index of wild-type (WT) and hcm1 cells.
Figure 3.
Figure 3.
Hcm1 regulates cell cycle expression of DSN1, CIN8, and SPC34. (A) S1 nuclease protection assays for DSN1, CIN8, and SPC34 showing periodic expression in wild-type HCM1 and deregulation in hcm1 yeast cells. ACT1 was used as a loading control. (B) Quantification of gels shown in A plotted as a ratio of variant transcript over control (ACT1). (C) HCM1 and hcm1 budding profiles. (D) ChIP analysis: binding of Flag-tagged Hcm1 to the CIN8 promoter. ACT1 serves as negative control (NC).
Figure 4.
Figure 4.
Hcm1 regulates expression of five TFs. The left panel shows the S1 nuclease protection assays through the cell cycle in wild-type and hcm1 cells, and the right panel shows the quantification of those gels for YHP1 (A), NDD1 and WHI5 (B), and FKH1 and FKH2 (C). The target RNA were normalized with the actin (ACT1) RNA and plotted as a ratio.
Figure 5.
Figure 5.
Periodicity of HCM1 transcript and Hcm1 protein levels. (A) Quantitative S1 of HCM1 mRNA through the cell cycle. (B) Immunoblots showing the levels of Myc-tagged Hcm1 and of Myc-tagged Hcm1 under control of the GAL1 constitutive promoter monitored across the cell cycle of α-factor synchronized wild-type (WT) cells. Asterisk indicates additional bands that could be either breakdown products or shortened active versions of the protein. (C) S1 gels showing mRNA profiles of Hcm1 targets (WHI5 and NDD1) through the cell cycle in the presence of GAL:HCM1 or wild-type HCM1. The synchrony of these two cell cycles, as indicated by percentage of budded cells, is shown underneath the panels. (D) Quantitation of the gels shown in C.
Figure 6.
Figure 6.
Genomic instability in hcm1 cells. (A) Increased chromosome loss in hcm1 cells compared with wild type (WT) can be visualized as sectoring or dark clonal patches in colonies. (B) FACS across the cell cycle in wild-type and hcm1 cells.
Figure 7.
Figure 7.
Hcm1 functions as an S-phase-specific transcriptional activator. HCM1 is activated by the Swi4/Swi6 complex. It then transcriptionally activates WHI5, which represses the subsequent round of Swi4/swi6 targets until late G1. Similarly, activation of YHP1 maintains the repression of M/G1 transcription. At the same time, activation of FKH1, FKH2, and NDD1 induces the next wave of G2/M transcription. This model connects the known cell cycle regulatory TFs to each other in a continuous cycle. However, there are hundreds of transcripts that are not targets of these factors that must be accounted for before we have a comprehensive picture of the cell cycle-regulated transcription that underlies the cell cycle.

References

    1. Adams I.R., Kilmartin J.V. Spindle pole body duplication: A model for centrosome duplication? Trends Cell Biol. 2000;10:329–335. - PubMed
    1. Alvarez B., Martinez A.C., Burgering B.M., Carrera A.C. Forkhead transcription factors contribute to execution of the mitotic programme in mammals. Nature. 2001;413:744–747. - PubMed
    1. Ashburner M., Ball C.A., Blake J.A., Botstein D., Butler H., Cherry J.M., Davis A.P., Dolinski K., Dwight S.S., Eppig J.T., et al. Gene Ontology: Tool for the unification of biology. Nat. Genet. 2000;25:25–29. - PMC - PubMed
    1. Bar-Joseph Z., Gerber G., Simon I., Gifford D.K., Jaakkola T.S. Comparing the continuous representation of time-series expression profiles to identify differentially expressed genes. Proc. Natl. Acad. Sci. 2003;100:10146–10151. - PMC - PubMed
    1. Bean J.M., Siggia E.D., Cross F.R. High functional overlap between MluI cell-cycle box binding factor and Swi4/6 cell-cycle box binding factor in the G1/S transcriptional program in Saccharomyces cerevisiae . Genetics. 2005;171:49–61. - PMC - PubMed

Publication types

MeSH terms

Substances