. 2006 Aug 15;20(16):2293-305.
doi: 10.1101/gad.390906.

Plasticity and expanding complexity of the hepatic transcription factor network during liver development

Affiliations

Plasticity and expanding complexity of the hepatic transcription factor network during liver development

Irene Kyrmizi et al. Genes Dev. .

Abstract

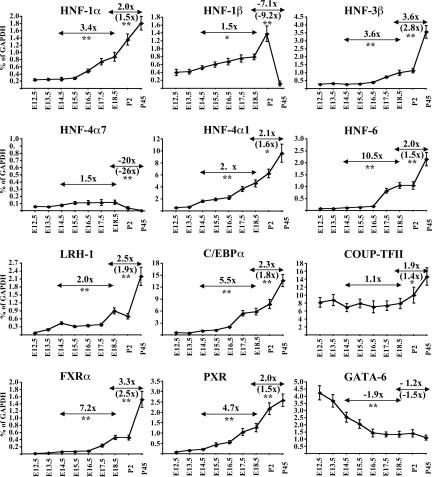
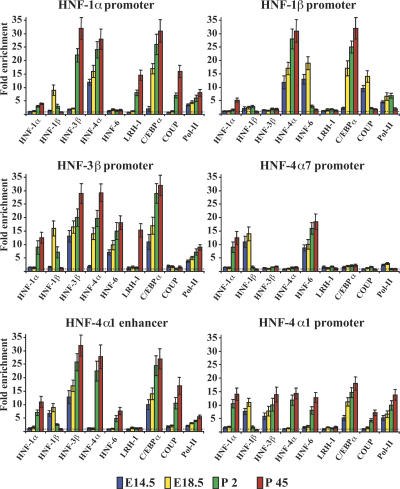
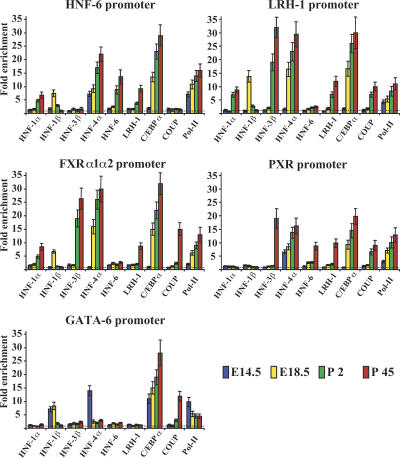
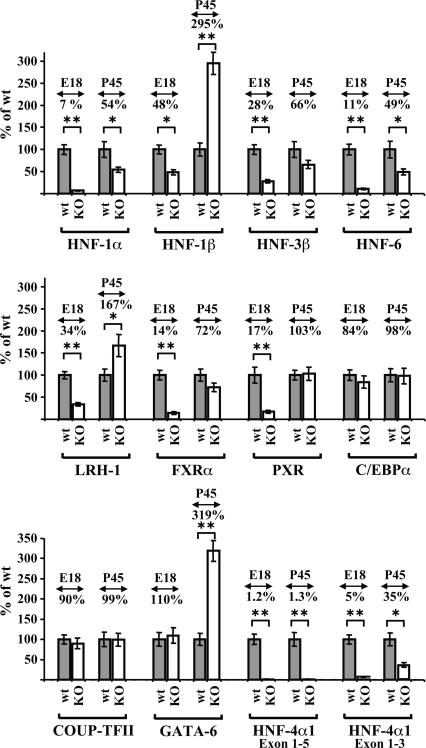
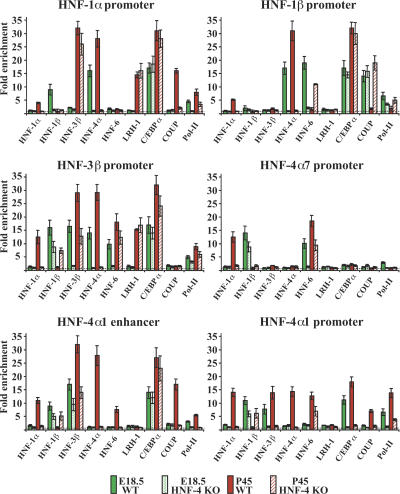
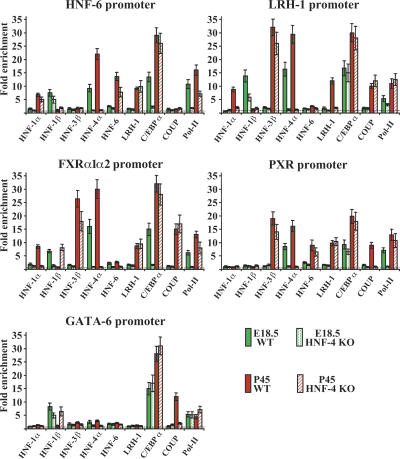
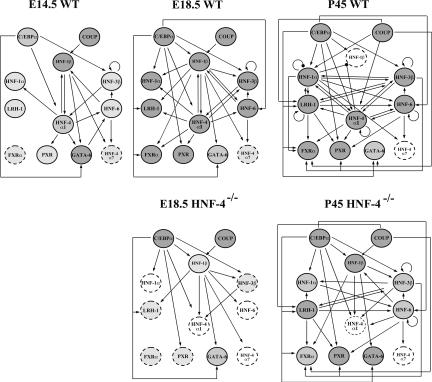
Cross-regulatory cascades between hepatic transcription factors have been implicated in the determination of the hepatic phenotype. Analysis of recruitments to regulatory regions and the temporal and spatial expression pattern of the main hepatic regulators during liver development revealed a gradual increase in complexity of autoregulatory and cross-regulatory circuits. Within these circuits we identified a core group of six transcription factors, which regulate the expression of each other and the expression of other downstream hepatic regulators. Changes in the promoter occupancy patterns during development included new recruitments, release, and exchange of specific factors. We also identified promoter and developmental stage-specific dual regulatory functions of certain factors as an important feature of the network. Inactivation of HNF-4alpha in embryonic, but not in adult, liver resulted in the diminished expression of most hepatic factors, demonstrating that the stability of the network correlates with its complexity. The results illustrate the remarkable flexibility of a self-sustaining transcription factor network, built up by complex dominant and redundant regulatory motifs in developing hepatocytes.


Figures

Figure 1.
Figure 1.
Changes in mRNA levels of hepatic transcription factors in liver tissues between E12.5 and P45. Graphs show the mean values and standard errors of absolute amounts of mRNAs of the transcription factors compared with the absolute amounts of GAPDH at the indicated stages from three different pools of livers. Numbers above double arrows depict the fold difference between E14.5 and E18.5, or the difference between E18.5 and P45 data. Numbers in parentheses show fold differences normalized to the estimated relative ratios of hepatocytes in E18.5 and P45 livers. Statistical analysis was performed by an unpaired Student's t-test. (*) P < 0.05; (**) P < 0.01. Note the different scales of the Y-axes.
Figure 2.
Figure 2.
Analysis of transcription factor recruitment to the HNF-1α, HNF-1β, HNF-3β, and HNF-4α regulatory regions. Chromatin immunoprecipitations with antibodies against the different transcription factors, shown below the X-axis, were performed in cross-linked chromatin prepared from E14.5, E18.5, P2, and P45 livers. The data from qPCR reactions (with primer sets shown in Supplemental Table 3) were first normalized to the input and expressed as fold enrichment over those obtained with nonimmune serum, which were set at value 1 (dashed horizontal line). Bars show mean values and standard errors from experiments performed with three different pools of livers. Qualitative assessment of the occupancy data is also presented in Supplemental Table 1.
Figure 3.
Figure 3.
Analysis of transcription factor recruitment to the HNF-6, LRH-1, FXRα1α2, PXR, and GATA-6 promoter regions. The graphs show the data of chromatin immunoprecipitation assays with the indicated antibodies and are presented as in Figure 2.
Figure 4.
Figure 4.
Effects of HNF-4α inactivation on the expression of hepatic regulators in fetal and adult livers. Quantitative RTPCR reactions using pooled total RNAs from embryonic (E18.5) and adult (P45) livers as in Figure 1. The liver tissues were from wild-type (wt) animals (gray bars) or HNF-4α-deficient (KO) animals (white bars). HNF-4α KO livers were from HNF-4lox/lox/ Alfp-Cre mice (E18.5) and HNF-4lox/lox/Alb-Cre (P45) mice, as indicated. The bars represent mean values, expressed as a percentage of those obtained with wild-type samples, and standard errors from three different pools. Numbers above the bars depict the average percentages of mRNA levels in HNF-4α KO livers compared with wild-type livers. Statistical analysis was performed by an unpaired Student's t-test. (*) P < 0.05; (**) P < 0.01.
Figure 5.
Figure 5.
Transcription factor recruitment to the HNF-1α, HNF-1β, HNF-3β, and HNF-4α regulatory regions in wild-type and HNF-4-deficient mouse livers. Chromatin immunoprecipitations with the indicated antibodies were performed in pooled liver extracts prepared from wild-type E18.5 embryos (E18.5 WT), HNF-4lox/lox/Alfp-Cre E18.5 embryos (E18.5 HNF-4 KO), wild-type 45-d-old mice (P45 WT) and HNF-4lox/lox/Alb-Cre 45-d-old mice (P45 HNF-4 KO), as indicated. Bars show mean values and standard errors from experiments performed with three different pools of livers. Qualitative assessment of the occupancy data is also presented in Supplemental Table 1
Figure 6.
Figure 6.
Transcription factor recruitment to the HNF-6, LRH-1, FXRα1α2, PXR, and GATA-6 promoters in wild-type and HNF-4-deficient mouse livers. The graphs show the data of chromatin immunoprecipitation assays with the indicated antibodies and are presented as in Figure 5.
Figure 7.
Figure 7.
Schematic presentations of cross-regulatory interactions between the hepatic regulators. Maps of promoter occupancies in livers of the indicated animals were drawn based on the chromatin immunoprecipitation data. Relative expression levels of the individual regulators are depicted as follows: (white dashed circles) no expression; (light-gray dashed circles) low expression; (gray full circles) increased expression; (dark-gray full circles) high expression.

References

    1. Bailly A., Spath G., Bender V., Weiss M.C. Phenotypic effects of the forced expression of HNF4 and HNF1α are conditioned by properties of the recipient cell. J. Cell Sci. 1998;111:2411–2421. - PubMed
    1. Bossard P., Zaret K.S. Repressive and restrictive mesodermal interactions with gut endoderm: Possible relation to Meckel's Diverticulum. Development. 2000;127:4915–4923. - PubMed
    1. Boulias K., Katrakili N., Bamberg K., Underhill P., Greenfield A., Talianidis I. Regulation of hepatic metabolic pathways by the orphan nuclear receptor SHP. EMBO J. 2005;24:2624–2633. - PMC - PubMed
    1. Briancon N., Bailly A., Clotman F., Jacquemin P., Lemaigre F.P., Weiss M.C. Expression of the α7 isoform of hepatocyte nuclear factor (HNF) 4 is activated by HNF6/ OC-2 and HNF1 and repressed by HNF4α1 in the liver. J. Biol. Chem. 2004;279:33398–33408. - PubMed
    1. Bulla G.A. Hepatocyte nuclear factor-4 prevents silencing of hepatocyte nuclear factor-1 expression in hepatoma x fibroblast cell hybrids. Nucleic Acids Res. 1997;25:2501–2508. - PMC - PubMed

Publication types

MeSH terms