. 2006 Sep;80(17):8291-302.
doi: 10.1128/JVI.00389-06.

Human T-cell leukemia virus type 1 (HTLV-1) and HTLV-2 use different receptor complexes to enter T cells

Affiliations

Human T-cell leukemia virus type 1 (HTLV-1) and HTLV-2 use different receptor complexes to enter T cells

Kathryn S Jones et al. J Virol. 2006 Sep.

Abstract

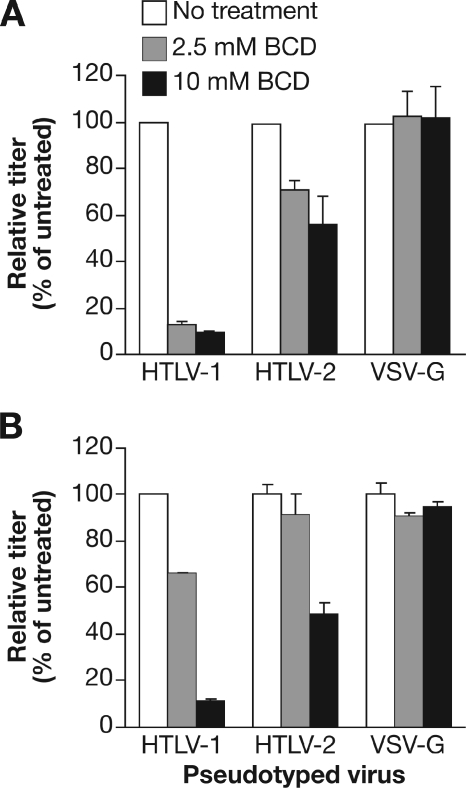
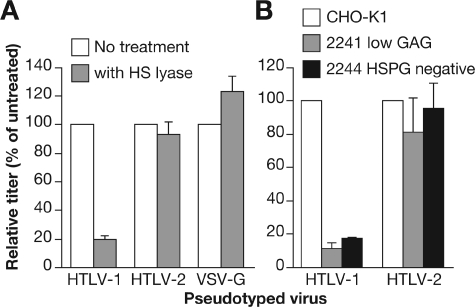
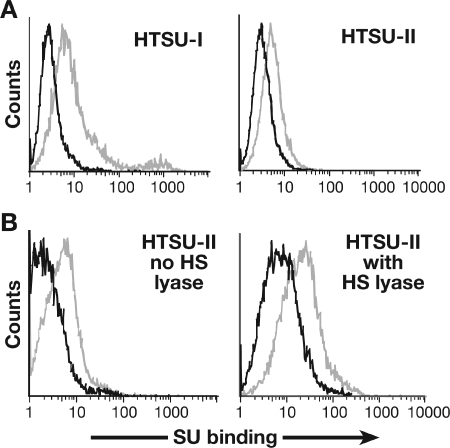
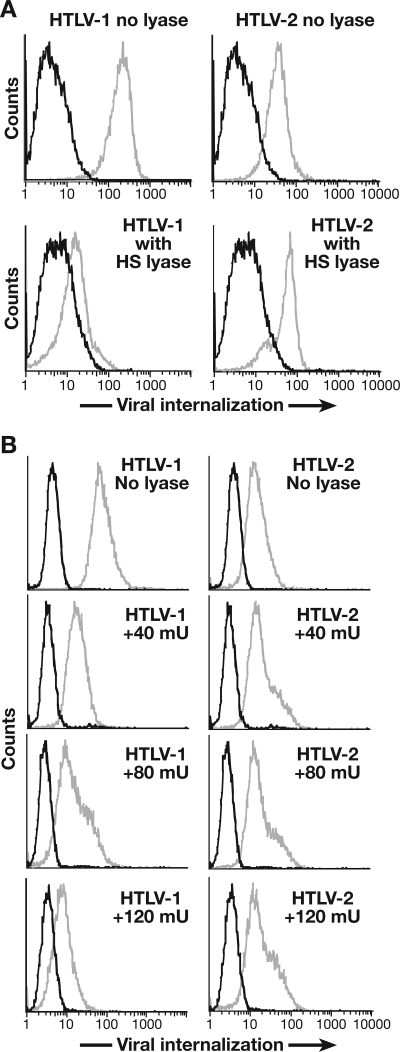
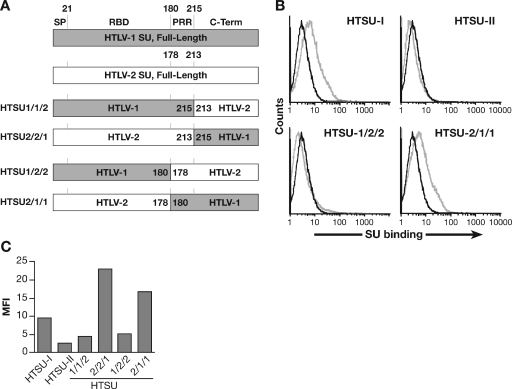
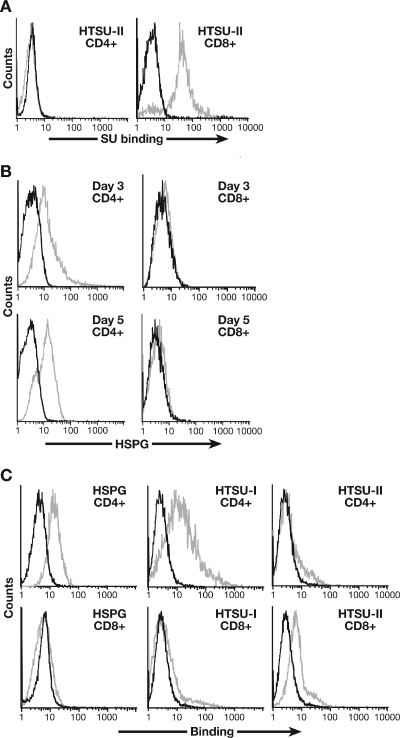
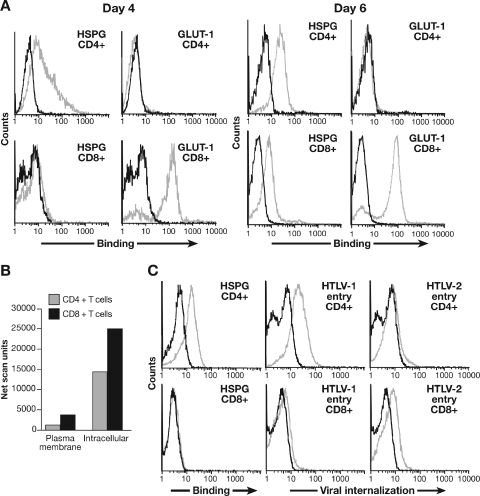
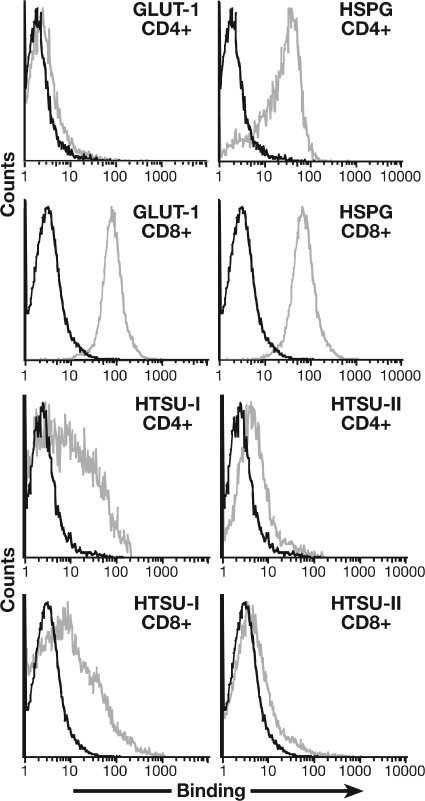
Studies using adherent cell lines have shown that glucose transporter-1 (GLUT-1) can function as a receptor for human T-cell leukemia virus type 1 (HTLV). In primary CD4(+) T cells, heparan sulfate proteoglycans (HSPGs) are required for efficient entry of HTLV-1. Here, the roles of HSPGs and GLUT-1 in HTLV-1 and HTLV-2 Env-mediated binding and entry into primary T cells were studied. Examination of the cell surface of activated primary T cells revealed that CD4(+) T cells, the primary target of HTLV-1, expressed significantly higher levels of HSPGs than CD8(+) T cells. Conversely, CD8(+) T cells, the primary target of HTLV-2, expressed GLUT-1 at dramatically higher levels than CD4(+) T cells. Under these conditions, the HTLV-2 surface glycoprotein (SU) binding and viral entry were markedly higher on CD8(+) T cells while HTLV-1 SU binding and viral entry were higher on CD4(+) T cells. Binding studies with HTLV-1/HTLV-2 SU recombinants showed that preferential binding to CD4(+) T cells expressing high levels of HSPGs mapped to the C-terminal portion of SU. Transfection studies revealed that overexpression of GLUT-1 in CD4(+) T cells increased HTLV-2 entry, while expression of HSPGs on CD8(+) T cells increased entry of HTLV-1. These studies demonstrate that HTLV-1 and HTLV-2 differ in their T-cell entry requirements and suggest that the differences in the in vitro cellular tropism for transformation and in vivo pathobiology of these viruses reflect different interactions between their Env proteins and molecules on CD4(+) and CD8(+) T cells involved in entry.


Figures

FIG. 1.
FIG. 1.
Effect of lipid raft disruption on HTLV-1 Env- and HTLV-2 Env-mediated entry. HTLV-1 Env-, HTLV-2 Env-, or VSV-G-pseudotyped virus particles were generated as described in Materials and Methods. SupT1 cells (A) or Jurkat cells (B) were washed once in serum-free medium, resuspended at 5 × 10⁶/ml in serum-free RPMI medium containing 0, 2.5, or 10 mM BCD and incubated at 37°C for 1 h. Cells were then washed three times with RPMI medium, resuspended in 0.5 ml of RPMI medium, and then mixed with an equal volume of the pseudotyped virus. The cells were transduced by spinoculation and then harvested 4 days later, and the titer was determined as described in Materials and Methods. Titers obtained in the absence of BCD were normalized to 100, and the relative titer was determined using the following formula: (titer with BCD/titer without BCD) × 100. The titer for each of the pseudotyped vectors in the absence of BCD was then determined. In SupT1 cells the titers in experiment 1 for each vector were the following: HTLV-1, 1.60 × 10⁴; HTLV-2, 2.55 × 10³; VSV-G, 5.54 × 10⁷. In SupT1 cells the titers in experiment 2 were the following: HTLV-1, 5.95 × 10⁴; HTLV-2, 1.95 × 10³; and VSV-G, 1.06 × 10⁷. In Jurkat cells, the titers were the following: HTLV-1, 5.62 × 10³; HTLV-2, 1.15 × 10³; and VSV-G, 4.33 × 10⁶. For panel A, data shown are the average of two independent experiments; error bars represent standard deviation. For panel B, the titers were determined in duplicate; the error bars represent standard deviation. White bars, no BCD; gray bars, 2.5 mM BCD; black bars, 10 mM BCD. Data are from a representative experiment out of five (A) or three (B) performed.
FIG. 2.
FIG. 2.
Effects of HSPG cell surface expression on HTLV-1 Env and HTLV-2 Env-mediated entry. (A) COS-7 cells (106) were suspended in 200 μl of HS lyase buffer (20 mM Tris, pH 7.4, 0.01% BSA, and 4 mM CaCl2) and then incubated for 2 h at 37°C with either 120 mU of HS lyase (gray bars) or left untreated (white bars). HTLV-1 Env-, HTLV-2 Env-, or VSV-G-pseudotyped virus particles were generated and used to transduce the COS-7 cells without spinoculation, and the titers were determined 3 days later. (B) HTLV-1 Env- and HTLV-2 Env-pseudotyped virus particles were used to transduce CHO-K1 cells (white bars), CHO-K1 2241 cells (gray bars), and CHO-K1 2244 cells (black bars) without spinoculation, and the titers were determined 3 days later. The data are the average of two independent experiments; error bars represent standard deviation. The titer for each of the pseudotyped virions on COS-7 cells in the absence of treatment (A) was as follows in experiment 1: HTLV-1, 6.8 × 10³; HTLV-2, 5.4 × 10⁴; VSV-G, 4.2 × 10⁴. In experiment 2 the titers in COS-7 cells were as follows: HTLV-1, 5.9 × 10⁴; HTLV-2, 3.7 × 10⁴; VSV-G, 7.2 × 10⁴. The titer for each of the pseudotyped vectors on the parental CHO-K1 cells (B) in experiment 1 were 4.4 × 10³ for HTLV-1 and 4.0 × 10³ for HTLV-2. In experiment 2 the titers in CHO-K1 cells were 7.8 × 10⁴ for HTLV-1 and 5.7 × 10⁴ for HTLV-2. Data shown are representative; an additional two (A) or three (B) experiments were performed.
FIG. 3.
FIG. 3.
Effect of HSPGs on HTLV-2 SU binding on CD4+ T cells. (A) MOLT4 cells were incubated with 200 ng of either the soluble form of HTLV-1 SU (HTSU-IgG), the soluble form of HTLV-2 SU (HTSUII-IgG), or, as a negative control, a similar fusion protein (SUA-IgG) containing the SU protein from the avian retrovirus avian leukosis and sarcoma virus subgroup A. The amount of binding was determined by flow cytometry. The mean fluorescence intensity in this and all of the binding studies described was determined by subtracting the mean fluorescence intensity of the control (SUA-IgG) binding from the mean fluorescence intensity of specific (soluble HTLV SU) binding. Black line, SUA-IgG; gray line, HTSU-IgG or HTSUII-IgG. The mean fluorescence intensities of HTSU-IgG and HTSUII-IgG were 7.0 and 2.2, respectively. (B) CD4+ T cells, isolated from adult peripheral blood and activated for 5 days with anti-CD3/anti-CD28 antibody beads, were incubated with or without 10 mU of HS lyase. The left frame represents the binding of 200 ng of soluble HTLV-2 SU with no HS lyase, while the right frame represents the binding of soluble HTLV-2 SU with HS lyase. Black line, SUA-IgG; gray line, HTSUII-IgG. The mean fluorescence intensity of HTSUII-IgG incubated in buffer alone was 2.4, and for HTSUII-IgG treated with HS lyase, it was 12.2. Data are from a representative experiment out of two (A) or four (B) performed.
FIG. 4.
FIG. 4.
Effect of HSPGs on HTLV-2 entry into CD4+ T cells. (A) CD4+ T cells were isolated from adult peripheral blood lymphocytes, activated for 6 days with anti-CD3/anti-CD28 antibody beads, and then resuspended in HS lyase buffer and treated with 10 mU of HS lyase (bottom) or left untreated (top). The extent of viral internalization was determined 2 h after exposing the cells to 2 ng of either HTLV-1 (left) or HTLV-2 (right) as described in Materials and Methods. Black line, mouse IgG1 (isotype control); gray line, anti-HTLV MA (p19) antibody. The mean fluorescence intensity values were as follows: for HTLV-1 incubated in buffer alone, 174.5; for HTLV-1 treated with HS lyase, 7.2; for HTLV-2 incubated in buffer alone, 29.3; for HTLV-2 treated with HS lyase, 28.0. (B) SupT1 cells were resuspended in HS lyase buffer and incubated with 0, 40 mU, 80 mU, or 120 mU of HS lyase, as indicated, and the extent of internalization of 1 ng of virus was determined as in described for panel A. The mean fluorescence intensity values for HTLV-1 internalization were the follow ing under the specified conditions: incubated in buffer alone, 65.6; treated with 40 mU of HS lyase, 12.6; treated with 80 mU of HS lyase, 10.8; treated with 120 mU of HS lyase, 4.8. The mean fluorescence intensity values for HTLV-2 internalization were the following under the specified conditions: incubated in buffer alone, 65.6; treated with 40 mU of HS lyase, 12.6; treated with 80 mU of HS lyase, 10.8; treated with 120 mU of HS lyase, 4.8. The mean fluorescence intensity values for HTLV-2 internalization were the following under the specified conditions: incubated in buffer alone, 10.4; treated with 40 mU HS lyase, 16.4; treated with 80 mU HS lyase, 15.3; treated with 120 mU HS lyase, 14.9. Data are from a representative experiment out of six (A) or three (B) performed.
FIG. 5.
FIG. 5.
Differences in HTLV-1 and HTLV-2 binding to CD4+ T cells map to the C-terminal region of SU. (A) Schematic drawing of the SU coding regions of the vectors encoding parental and recombinant soluble HTLV SU. (B) CD4+ T cells, from adult peripheral blood, were activated for 3 days by PHA and IL-2. The binding of 100 ng of HTSU-IgG, HTSUII-IgG, HTSU1/2/2-IgG, HTSU2/1/1-IgG, and the control SUA was determined by flow cytometry. Black line, SUA-IgG; gray line, soluble HTLV SU. The mean fluorescence intensity values were as follows: for HTSU-IgG, 4.6; HTSUII-IgG, 0.5; HTSU1/2/2-IgG, 0.7; HTSU2/1/1-IgG, 3.6. (C) CD4+ T cells isolated from adult peripheral blood were activated with PHA and IL-2. The binding of 200 ng of HTSU-IgG, HTSUII-IgG, HTSU1/2/2-IgG, HTSU2/1/1-IgG, HTSU1/1/2-IgG, HTSU2/2/1-IgG, and the control SUA was determined by flow cytometry.
FIG. 6.
FIG. 6.
Expression of HSPGs and the level of HTLV-2 SU binding on CD4+ and CD8+ T cells. (A) CD4+ and CD8+ T cells were isolated from cord blood lymphocytes by positive selection and activated by PHA and IL-2. Six days later, the level of binding of 200 ng of HTSUII-IgG was determined. Black line, SUA-IgG; gray line, HTSUII-IgG. The mean fluorescence intensity values were 0.2 for CD4+ and 21.9 for CD8+. (B) T lymphocytes were isolated from adult peripheral blood, separated into CD4+ and CD8+ populations, and activated by CD3/CD28 beads. Three and five days later, the cells were harvested and the level of HSPGs was determined. Black line, IgM isotype control; gray line, anti-HSPG antibody (F58-10E4). The mean fluorescence intensity values were 9.4 for CD4+ and 0.1 for CD8+ on day 3; on day 5 they were 7.8 for CD4+ and 0.4. for CD8+. (C) CD4+ and CD8+ T cells were isolated from cord blood lymphocytes and activated by PHA and IL-2, and the level of binding of 100 ng of SU protein was determined 16 h later. Left panels: black line, IgM isotype control; gray line, anti-HSPG antibody (F58-10E4). Middle and right panels: black line, SUA-IgG; gray line, HTSU-IgG (middle) or HTSUII-IgG (right). The mean fluorescence intensity values were as follows: HSPG/CD4+, 9.9; HSPG/CD8+, 0.83; HTSU/CD4+, 10.5; HTSU/CD8+, 1.0; HTSUII/CD4+, 1.1; HTSUII/CD8+, 4.0.
FIG. 7.
FIG. 7.
Influence of endogenous cell surface levels of GLUT-1 and HSPGs on internalization of HTLV-1 and HTLV-2 virions into CD4+ and CD8+ T cells. (A) CD4+ and CD8+ T lymphocytes, isolated from adult peripheral blood, were analyzed for HSPG and GLUT-1 expression at 4 (left) and 6 (right) days after activation with anti-CD3/CD28 beads. Black line, isotype control; gray line, anti-HSPG antibody (F58-10E4) or anti-GLUT-1 (MAb 1418). The mean fluorescence intensity values on day 4 were as follows: HSPG/CD4+, 12.0; HSPG/CD8+, 0.2; GLUT-1/CD4+, −0.4; GLUT-1/CD8+, 60.4. Day 6 values were as follows: HSPG/CD4+, 15.9; HSPG/CD8+, 4.9; GLUT-1/CD4+, −0.2; GLUT-1/CD8+, 36.0. (B) Five days after activation, CD4+ and CD8+ T cells were exposed to UV light in the presence of a biotinylated photoaffinity label, lysed, processed, and analyzed as described in Materials and Methods. The level of membrane and intracellular GLUT-1 on the resulting Western blot was quantified. The net scan units were determined from the pixel density of bands on the scanned blot using the following formula: net scan units = total scan units of protein band − scan units of background (a nonradioactive portion of same column of the Western blot). (C) CD4+ and CD8+ T cells were harvested 2 days after activation. A portion of the samples was used to determine the cell surface levels of HSPG; the remainder was exposed to 1 ng of HTLV virions, and internalization levels were determined. Left panels: black line, IgM isotype control; gray line, anti-HSPG antibody (F58-10E4). Middle and right panels: black line, no virus; gray line, HTLV-1 (middle) or HTLV-2 (right). The mean fluorescence intensity values were as follows: HSPG/CD4+, 10.2; HSPG/CD8+, 0.2; HTLV-1 entry/CD4+, 15.7; HTLV-1 entry/CD8+, 1.1; HTLV-2 entry/CD4+, 0.7; HTLV-2 entry/CD8+, 6.0.
FIG. 8.
FIG. 8.
Effect of high endogenous cell surface levels of HSPGs on CD8+ T cells on binding of HTLV-1 and HTLV-2 SU. CD4+ and CD8+ T cells were isolated from cord blood lymphocytes, activated by CD3/CD28 beads, and harvested 12 days later. Flow cytometry studies were performed as described in the legends of Fig. 7 (for HSPG and GLUT-1) and Fig. 6 (for HTSU-IgG and HTSUII-IgG). Black line, isotype control; gray line, anti-HSPG antibody (F58-10E4), anti-GLUT-1 (MAb 1418), HTSU-IgG, or HTSUII-IgG. The mean fluorescence intensity values were as follows: GLUT-1/CD4+, 0.73; GLUT-1/CD8+, 75.2; HSPG/CD4+, 18.5; HSPG/CD8+, 63.4; HTSU/CD4+, 6.4; HTSU/CD8+, 4.1; HTSUII/CD4+, 2.12; HTSUII/CD8+, 1.5.
FIG. 9.
FIG. 9.
Effect of ectopic expression of HSPG in CD8+ T cells and GLUT-1 in CD4+ T cells on internalization of HTLV-1 and HTLV-2 virions. (A) Activated CD8+ T cells were transfected 3 days after activation either with a construct encoding syndecan-4, a type of HSPG, or a control plasmid (pcDNA). Two days later, the cells were exposed to 1 ng of HTLV-1 and HTLV-2 virions, and the amount of internalization was determined 2 h later. The mean fluorescence intensity values were as follows: HTLV-1 entry/pcDNA, 0.7; HTLV-1 entry/syndecan-4, 3.2; HTLV-2 entry/pcDNA, 2.6; HTLV-2 entry/syndecan-4, 1.67. (B) MOLT4 cells, a CD4+ T-cell line, were transfected with a GLUT-1-expressing plasmid (HA-GLUT-1) or a plasmid expressing a control glucose transporter (HA-GLUT-6 M). Three days later, they were exposed to 1 ng of either HTLV-1 or HTLV-2 virions, and the amount of internalization was determined 2 h later. Black lines, IgG1 isotype control; gray lines, anti-HTLV p19 (MA) antibody. The mean fluorescence intensity values were as follows: HTLV-1 entry/GLUT-6M, 2.5; HTLV-1 entry/GLUT-1, 3.7; HTLV-2 entry/GLUT-6M, −0.6; HTLV-2 entry/GLUT-1, 5.2.

References

    1. Albritton, L. M., L. Tseng, D. Scadden, and J. M. Cunningham. 1989. A putative murine ecotropic retrovirus receptor gene encodes a multiple membrane-spanning protein and confers susceptibility to virus infection. Cell 57:659-666. - PubMed
    1. Al-Hasani, H., D. R. Yver, and S. W. Cushman. 1999. Overexpression of the glucose transporter GLUT4 in adipose cells interferes with insulin-stimulated translocation. FEBS Lett. 460:338-342. - PubMed
    1. Argyris, E. G., E. Acheampong, G. Nunnari, M. Mukhtar, K. J. Williams, and R. J. Pomerantz. 2003. Human immunodeficiency virus type 1 enters primary human brain microvascular endothelial cells by a mechanism involving cell surface proteoglycans independent of lipid rafts. J. Virol. 77:12140-12151. - PMC - PubMed
    1. Battini, J. L., O. Danos, and J. M. Heard. 1995. Receptor-binding domain of murine leukemia virus envelope glycoproteins. J. Virol. 69:713-719. - PMC - PubMed
    1. Battini, J. L., J. M. Heard, and O. Danos. 1992. Receptor choice determinants in the envelope glycoproteins of amphotropic, xenotropic, and polytropic murine leukemia viruses. J. Virol. 66:1468-1475. - PMC - PubMed

Publication types

MeSH terms