. 2006 Sep;80(17):8450-8.
doi: 10.1128/JVI.00839-06.

Antiviral potency of APOBEC proteins does not correlate with cytidine deamination

Affiliations

Antiviral potency of APOBEC proteins does not correlate with cytidine deamination

Kate N Bishop et al. J Virol. 2006 Sep.

Abstract

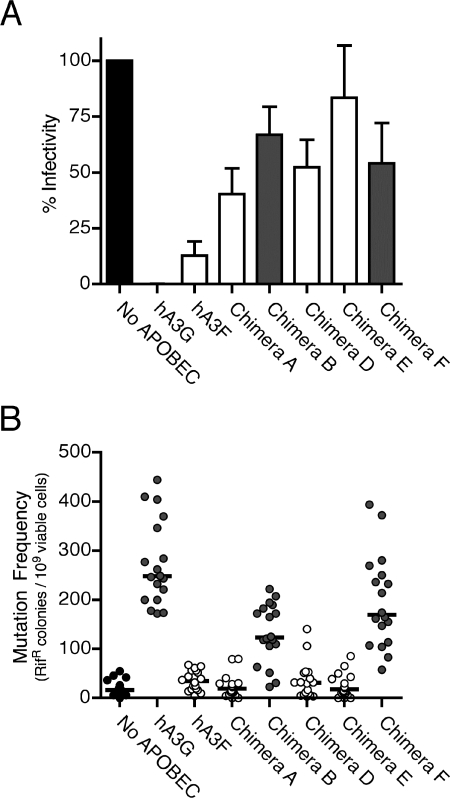
The human cytidine deaminases APOBEC3G (hA3G) and APOBEC3F (hA3F) are intracellular antiretroviral factors that can hypermutate nascent reverse transcripts and inhibit the replication of human immunodeficiency virus type 1 (HIV-1). Both enzymes have two cytidine deaminase motifs, although only the C-terminal motif is catalytic. Current models of APOBEC protein function imply editing is the principal mechanism of antiviral activity. In particular, hA3G is a more potent inhibitor of HIV-1 infectivity than hA3F and also induces a greater frequency of mutations in HIV-1 cDNA. We used hA3G/hA3F chimeric proteins to investigate whether cytidine deaminase potential reflects antiviral potency. We show here that the origin of the C-terminal deaminase motif is sufficient to determine the degree of mutation induced in a bacterial assay that measures mutations in chromosomal DNA. In contrast, this was not the case in the context of HIV-1 infection where the N-terminal deaminase motif also modulated the editing capabilities of the chimeras. Surprisingly, although three of the chimeric proteins induced levels of mutation that approximated those of parental hA3F, they displayed lower levels of antiviral activity. Most importantly, real-time PCR experiments revealed that the quantity of reverse transcripts detected in target cells, rather than the mutational burden carried by such DNAs, corresponded closely with viral infectivity. In other words, the antiviral phenotype of APOBEC proteins correlates with their ability to prevent the accumulation of reverse transcripts and not with the induction of hypermutation.


Figures

FIG. 1.
FIG. 1.
Illustration of chimeric hA3G and hA3F proteins. Chimeric hA3G and hA3F cDNAs were constructed by using PCR, producing a panel of chimeric open reading frames. Dark gray shading indicates hA3G sequence, and light gray shading indicates hA3F sequence. The black boxes show the positions of the cytidine deaminase motifs.
FIG. 2.
FIG. 2.
Activity of hA3G/hA3F chimeras. (A) Effects of hA3G/hA3F chimeras on HIV-1 infectivity. vif-deficient HIV-1 was produced in the presence of either hA3G, hA3F, chimeric proteins, or a control vector. Normalized viral aliquots were used to challenge TZM-β-gal indicator cells, and productive infection was measured as the induction of β-galactosidase activity. Values are presented as percent infectivity relative to virus produced in the absence of any APOBEC protein (black bar). The gray and white bars indicate proteins expressing the C-terminal deaminase motif of hA3G and hA3F, respectively. The data are the means of five independent experiments, and error bars represent the standard deviation. (B) Effects of hA3G/hA3F chimeras on rifampin resistance (Rifr) in E. coli. Mutation frequencies are shown for 18 independent E. coli cultures expressing hA3G, hA3F, chimeric proteins, or a control vector. Each datum point corresponds to the number of Rif-resistant colonies in a single culture. The median mutation rate is shown for each condition (black line). Gray and white circles indicate proteins expressing the C-terminal deaminase motif of hA3G and hA3F, respectively.
FIG. 3.
FIG. 3.
Expression and viral incorporation of hA3G/hA3F chimeras. Immunoblot analysis of HA-tagged APOBEC proteins in 293T cells transfected with APOBEC expression plasmids and concentrated virus produced from these cells was carried out. HSP 90 and HIV-1 CA proteins were also detected to confirm equal cell and virion loading, respectively.
FIG. 4.
FIG. 4.
Comparison of the preferred sequence context for dC deamination in HIV-1 by hA3G, hA3F, or chimeric proteins. All of the mutations in HIV-1 induced by either hA3G, hA3F, or chimeras A, B, or F were aligned with respect to the dC residue targeted for deamination (position zero). The frequency (as a percentage) with which each of the four bases is found at positions adjacent to this dC is indicated. The consensus sequence is shown at the bottom of each minitable.
FIG. 5.
FIG. 5.
Effects of hA3G/hA3F chimeras on levels of viral reverse transcripts. (A) Quantitative real-time PCR analysis of acute HIV-1 infection in SupT1 cells. Equivalent amounts of vif-deficient virions produced from 293T cells expressing hA3G (light green), hA3F (light blue), chimera A (pink), chimera B (orange), chimera D (dark green), chimera E (dark blue), chimera F (purple), or no APOBEC (red) were added to SupT1 cells, and total DNA was harvested at the indicated times after infection. The relative levels of HIV-1 early reverse transcription products compared to standard samples are indicated. (B) Effects of hA3G/hA3F chimeras on HIV-1 infectivity. The viral preparations described above were used in parallel to challenge TZM-β-gal indicator cells, and productive infection was measured as the induction of β-galactosidase activity. Values are presented as the percent infectivity relative to virus produced in the absence of any APOBEC protein. Colors are as in panel A.
FIG. 6.
FIG. 6.
Correlation of viral infectivity with frequency of mutations and amounts of reverse transcripts. Correlation plots of viral infectivity (as the percent infectivity relative to virus produced in the absence of any APOBEC protein) versus the average number of mutations per 100 bp of sequenced viral cDNA (A), the percentage of clones sequenced that had at least one mutation (B), and the relative amount of early reverse transcripts compared to the amount of cDNA in the absence of any APOBEC protein (C), as measured by quantitative PCR, were prepared. Each point represents an individual viral preparation, and different experiments are identified by different symbols: panels A and B show data from experiments 1 (⧫) and 4 (•), and panel C shows the results of experiments 2 (▪), 3 (▴), and 4. The Pearson r value gives a measure of the correlation between each pair of variables. P is the probability that this correlation occurs by chance. Statistics were calculated by using GraphPad Prism version 4.0c.

References

    1. Bishop, K. N., R. K. Holmes, A. M. Sheehy, N. O. Davidson, S. J. Cho, and M. H. Malim. 2004. Cytidine deamination of retroviral DNA by diverse. - PubMed
    1. Bishop, K. N., R. K. Holmes, A. M. Sheehy, and M. H. Malim. 2004. APOBEC-mediated editing of viral RNA. Science 305:645. - PubMed
    1. Bogerd, H. P., H. L. Wiegand, B. P. Doehle, K. K. Lueders, and B. R. Cullen. 2006. APOBEC3A and APOBEC3B are potent inhibitors of LTR-retrotransposon function in human cells. Nucleic Acids Res. 34:89-95. - PMC - PubMed
    1. Chen, H., C. E. Lilley, Q. Yu, D. V. Lee, J. Chou, I. Narvaiza, N. R. Landau, and M. D. Weitzman. 2006. APOBEC3A is a potent inhibitor of adeno-associated virus and retrotransposons. Curr. Biol. 16:480-485. - PubMed
    1. Chiu, Y. L., V. B. Soros, J. F. Kreisberg, K. Stopak, W. Yonemoto, and W. C. Greene. 2005. Cellular APOBEC3G restricts HIV-1 infection in resting CD4+ T cells. Nature 435:108-114. - PubMed

Publication types

MeSH terms

LinkOut - more resources