. 2006 Sep;80(17):8613-26.
doi: 10.1128/JVI.00836-06.

Endoplasmic reticulum stress and neurodegeneration in rats neonatally infected with borna disease virus

Affiliations

Endoplasmic reticulum stress and neurodegeneration in rats neonatally infected with borna disease virus

B L Williams et al. J Virol. 2006 Sep.

Abstract

Borna disease virus infection of neonatal rats results in a characteristic behavioral syndrome and apoptosis of subsets of neurons in the hippocampus and cerebellum (neonatal Borna disease [NBD]). The cellular mechanisms leading to neurodevelopmental damage in NBD have not been fully elucidated. Insights into this model may have general implications for understanding the pathogenesis of virus-associated neurodevelopmental damage. Here we report the presence of endoplasmic reticulum (ER) stress markers and activation of the unfolded protein response in the NBD hippocampus and cerebellum. Specific findings included enhanced PERK-mediated phosphorylation of eif2alpha and concomitant regulation of ATF4 translation; IRE1-mediated splicing of XBP1 mRNA; and cleavage of the ATF6 protein in NBD rat brains. We found evidence for regional and cell type-specific divergence in the expression of ER stress-induced proapoptotic and quality control signals. Our results demonstrate that ER stress induction in death-susceptible Purkinje neurons in NBD is associated with the expression of the proapoptotic molecule CHOP in the absence of compensatory expression of the ER quality control molecules Bip and protein disulfide isomerase. In contrast, ER stress in death-resistant astrocytes is associated with complementary expression of CHOP and ER quality control signals. These results implicate an imbalance between ER stress-mediated apoptosis and survival signaling as a critical determinant of neural cell fate in NBD.


Figures
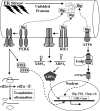
FIG. 1.
FIG. 1.
Schematic illustration of ER stress and UPR activation. ER stresses can result in accumulation of unfolded proteins in the ER. Unfolded proteins are bound by Bip, resulting in release and activation of three ER-resident transmembrane transducers of the UPR: PERK, IRE1, and ATF6. Activated PERK phosphorylates eif2α, attenuating global protein synthesis, and enhances translation of ATF4. Activated IRE1 facilitates splicing of XBP1U, resulting in translation of the transcriptionally active form of XBP1 (XBP1S). Following Bip release, ATF6 translocates to the Golgi, where it is cleaved by proteases, releasing the transcriptionally active form of ATF6 (ATF6p50). ATF4, XBP1S, and ATF6p50 enter the nucleus, where they activate the expression of a distinct set of UPR target genes.
FIG. 2.
FIG. 2.
Identification of ER stress genes in PND28 NBD rats by microarray analysis. Microarray analysis was conducted using pooled total RNA isolated from dissected CBLM and HC of PND28 NBD (n = 7) and PND28 control (n = 5) rats. (A) Results represent mean n-fold change ± standard deviation for genes from three independent experiments comparing RNA from NBD CBLM versus control CBLM (black bars) and mean n-fold change ± standard deviation for genes in NBD HC (gray bars) versus control HC. Genes were considered significant when n-fold induction or repression in NBD rats was >1.5 or <−1.5 and the P value was <0.05 compared to control results. Black asterisks denote genes meeting these criteria in NBD CBLM; gray asterisks denote genes meeting these criteria in NBD HC. Genes are grouped into known ER stress-responsive genes (group 1), genes involved in ER stress response (group 2), and regulators of ER calcium homeostasis (group 3). (B) Table showing n-fold induction or fold repression and P values for ER stress genes (accession no. provided) for NBD rat CBLM and HC. For gene abbreviations, see the text.
FIG. 3.
FIG. 3.
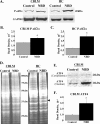
Activation of the PERK/eif2α/ATF4 arm of the UPR in NBD rats. (A) Cytoplasmic lysates (20 μg) from CBLM and HC of control and NBD rats were evaluated by Western analysis using antibodies specific for the phosphorylated form of eif2α (P-eif2α; upper panels) relative to levels of GAPDH (housekeeping gene; lower panels). (B and C) Determination of P-eif2α band density relative to that for GAPDH from control (n = 4) or NBD (n = 4) rat CBLM (B) (1.36-fold increase in NBD; ANOVA, P = 0.0136) or HC (C) (2.67-fold increase in NBD; ANOVA, P = 0.0007). (D) Sypro Ruby stain of protein extract (20 μg) from CBLM and HC of control and NBD rats. Note that relative levels of proteins are similar between control and NBD rats in both brain regions, with the exception of a single band in NBD lysates from HC corresponding to the BDV nucleoprotein (arrowhead). (E) Cytoplasmic (upper panel) and nuclear (lower panel) lysates from CBLM of control and NBD rats were evaluated by Western analysis using antibodies specific for ATF4. Note equal amounts of ATF4 protein in cytoplasmic lysates and higher ATF4 band signal in nuclear extracts from NBD rats compared to results for controls. (F) Determination of ATF4 band density from control (n = 4) or NBD (n = 4) nuclear protein extracts revealed increased ATF4 levels in NBD CBLM (3.06-fold increase in NBD; ANOVA, P = 0.0223). Asterisks indicate P values of <0.05.
FIG. 4.
FIG. 4.
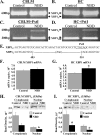
XBP1 mRNA is selectively spliced in NBD rats. RNA extracted from CBLM and HC of PND28 control (n = 5) and NBD (n = 7) rats was analyzed by RT-PCR using primers that amplify both unspliced XBP1 (XBP1U) and spliced (XBP1S) XBP1. (A and B) Representative gel images of XBP1 RT-PCR. Note detection of XBP1U in control rats and both XBP1U and XBP1S in NBD rat CBLM (A) or HC (B). (C and D) PstI digestion of XBP1 RT-PCR products. Note PstI-insensitive XBP1S band in NBD but not control rat CBLM (C) and HC (D). (E) Sequencing of XBP1U and XBP1S from CBLM and HC confirms excision of the 26-nucleotide intron from XBP1S in NBD rats. (F and G) SYBR Green real-time PCR analysis of total XBP1 mRNA in CBLM and HC of control (n = 5) and NBD (n = 7) rats. Note that XBP1 mRNA expression levels are unchanged in NBD CBLM (F) but are significantly increased in NBD HC (G: 1.3-fold increase in NBD; ANOVA, P = 0.005). (H and I) Western blot analysis of XBP1U (33 kDa) protein levels in CBLM and HC cytoplasmic and nuclear extracts from control (n = 4) and NBD (n = 4) rats. Representative blots are shown. (H) Relative band densities for CBLM extracts revealed a trend toward decreased XBP1U protein in cytoplasmic extracts (2.49-fold decrease in NBD; ANOVA, P = 0.065) and a significant decrease in nuclear extracts (1.72-fold decrease in NBD; ANOVA, P = 0.017) from NBD rats compared to controls. (I) Relative band density for HC extracts revealed significant decreases in XBP1U protein in both cytoplasmic (2.63-fold decrease in NBD; ANOVA, P = 0.033) and nuclear (3.02-fold decrease in NBD; ANOVA, P = 0.018) extracts from NBD rats compared to results for controls. Asterisks indicate P values of <0.05.
FIG. 5.
FIG. 5.
Enhanced cleavage of ATF6 in NBD rats. (A) Western immunoblots of ATF6 cleavage (ATF6p50) in cytoplasmic extracts from PND28 control and NBD CBLM (upper left panel) or HC (upper right panel). Corresponding signals for the GAPDH housekeeping gene are shown (lower panels). (B) ATF6p50 band density, relative to that for GAPDH, from control (n = 4) or NBD (n = 4) rat CBLM was significantly higher for NBD rats than for controls (1.33-fold increase for NBD; ANOVA, P = 0.0073). (C) ATF6p50 band density, relative to that for GAPDH, from control (n = 4) or NBD (n = 4) rat HC was significantly higher for NBD rats than for controls (2.74-fold increase in NBD; ANOVA, P = 0.0084). Asterisks indicate P values of <0.05.
FIG. 6.
FIG. 6.
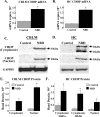
Increased CHOP mRNA and protein in NBD rats. (A and B) Real-time PCR analysis of CHOP mRNA in CBLM (A) and HC (B) of PND28 control (n = 5) or NBD (n = 7) rats. CHOP mRNA was significantly increased for NBD rats relative to results for control CBLM (A: 2.77-fold increase in NBD; ANOVA, P < 0.0001) or HC (B: 4.14-fold increase in NBD; ANOVA, P < 0.0001). (C and D) Representative Western immunoblots for CHOP protein in cytoplasmic (top panel) or nuclear (middle panel) extracts from control or NBD rat CBLM (C) or HC (D). Corresponding cytoplasmic immunoblot signals for GAPDH are shown (bottom panel). (E and F) Determination of CHOP protein band density in cytoplasmic and nuclear extracts from control (n = 4) or NBD (n = 4) rat CBLM (E) or HC (F). CBLM CHOP protein levels were significantly increased in both cytoplasmic (E: 21.4-fold increase in NBD; ANOVA, P < 0.0001) and nuclear (E: 11.34-fold increase in NBD; ANOVA, P = 0.0003) extracts from NBD rats, relative to results for controls. HC CHOP protein levels were significantly increased in both cytoplasmic (F: 26-kDa band, 3.48-fold increase in NBD; ANOVA, P = 0.043; and 30-kDa band, 7.49-fold increase in NBD; ANOVA, P = 0.009) and nuclear (F: 5.47-fold increase in NBD; ANOVA, P = 0.02) extracts from NBD rats, relative to controls. Asterisks indicate P values of <0.05.
FIG. 7.
FIG. 7.
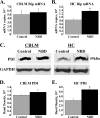
Hippocampus-specific increases in Bip mRNA and PDI protein levels. (A and B) SYBR green real-time PCR analysis of Bip transcript levels in CBLM (A) and HC (B) of PND28 control (n = 5) or NBD (n = 7) rats. Bip mRNA was not significantly altered in NBD CBLM (A). Note significant increase in HC Bip mRNA in NBD rats relative to controls (B: 1.61-fold increase in NBD; ANOVA, P = 0.0001). (C) Representative Western immunoblot analysis for PDI protein in CBLM and HC of control or NBD rats (upper panels). Corresponding immunoblot signals for the GAPDH housekeeping gene are shown (lower panels). (D and E) Quantitation of PDI immunoblot band density, relative to GAPDH signal, from control (n = 4) or NBD (n = 4) rat CBLM (D: not significant) and HC (E: 1.73-fold increase in NBD; ANOVA, P = 0.0009). Asterisks indicate P values of <0.05.
FIG. 8.
FIG. 8.
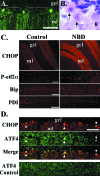
ER stress in NBD rat PCs. (A) Calbindin staining in the CBLM of PND28 NBD rats; note gaps in the PC and molecular layers (brackets). (B) H&E-stained PCs from PND28 NBD rat; note degenerating PCs with pyknotic and fragmented nuclei (arrows), with normal PC shown for comparison (arrowhead). (C) Representative CHOP, P-eif2α, Bip, and PDI immunofluorescence of PND28 control (left panels) or NBD (right panels) rat CBLM. Note intense CHOP and P-eif2α immunoreactivity in PCs of NBD rats compared to results for control rats. Bip and PDI signals are equivalent in control and NBD rat PCs. (D) Double-label immunofluorescence analysis of CHOP (red) and ATF4 (green) in PND28 NBD rat CBLM (merged image shows colocalized signal in PCs, arrowheads). ATF4 immunofluorescence in PND28 control rat CBLM shown for comparison (bottom panel). Abbreviations: gcl, granule cell layer; ml, molecular layer. Micron bars, 100 μm.
FIG. 9.
FIG. 9.
Induction of ER stress in hippocampal astrocytes (A and B) and Chop expression in diverse, degenerating neural populations (C and D) in NBD rats. (A) Double-label immunofluorescence for CHOP (left panel, red) and GFAP (middle panel, green) in HC of NBD rats (right panel, merged image). (B) CHOP, P-eif2α, Bip, and PDI immunofluorescence in dentate gyrus of PND28 control (left panels) or NBD (right panels) rats. Note intense immunoreactivity for CHOP, P-eif2α, Bip, and PDI in NBD rat astrocytes in dentate gyrus molecular layer and hilus compared to controls. (C) Chop immunofluorescence (left panels) and degenerative morphology (arrows in right panels) in cerebellar granule cell neurons (CBLM gcl), cortical neurons (Cortex), hippocampal CA3 pyramidal neurons (CA3), thalamic neurons (Thal.), and hypothalamic neurons (Hypothal.). (D) Chop immunofluorescence in mitral cells in the olfactory bulb of PND28 NBD rat. Note intense nuclear staining (wide arrowheads) and localization to nuclear bodies (narrow arrowheads). (E) Anti-BDV nucleoprotein staining of mitral cells in NBD rats. (F) H&E staining shows degenerating mitral cell (arrow) and normal mitral cell (arrowhead) in NBD rat. Abbreviations: gcl, granule cell layer; ml, molecular layer; Hi, hilus. Micron bars, 100 μm.

Similar articles

Cited by

References

    1. Barone, M. V., A. Crozat, A. Tabaee, L. Philipson, and D. Ron. 1994. CHOP (GADD153) and its oncogenic variant, TLS-CHOP, have opposing effects on the induction of G1/S arrest. Genes Dev. 8:453-464. - PubMed
    1. Bautista, J. R., S. A. Rubin, T. H. Moran, G. J. Schwartz, and K. M. Carbone. 1995. Developmental injury to the cerebellum following perinatal Borna disease virus infection. Brain Res. Dev. Brain Res. 90:45-53. - PubMed
    1. Bertolotti, A., Y. Zhang, L. M. Hendershot, H. P. Harding, and D. Ron. 2000. Dynamic interaction of BiP and ER stress transducers in the unfolded-protein response. Nat. Cell Biol. 2:326-332. - PubMed
    1. Bitko, V., and S. Barik. 2001. An endoplasmic reticulum-specific stress-activated caspase (caspase-12) is implicated in the apoptosis of A549 epithelial cells by respiratory syncytial virus. J. Cell. Biochem. 80:441-454. - PubMed
    1. Briese, T., A. Schneemann, A. J. Lewis, Y. S. Park, S. Kim, H. Ludwig, and W. I. Lipkin. 1994. Genomic organization of Borna disease virus. Proc. Natl. Acad. Sci. USA 91:4362-4366. - PMC - PubMed

Publication types

MeSH terms