. 2006 Jul 1;34(Web Server issue):W645-50.
doi: 10.1093/nar/gkl229.

Applications for protein sequence-function evolution data: mRNA/protein expression analysis and coding SNP scoring tools

Affiliations

Applications for protein sequence-function evolution data: mRNA/protein expression analysis and coding SNP scoring tools

Paul D Thomas et al. Nucleic Acids Res. .

Abstract

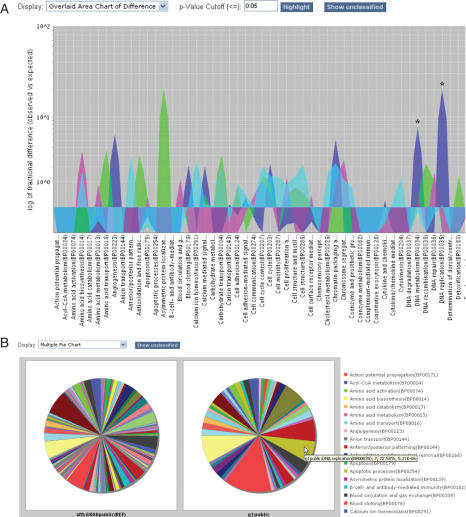
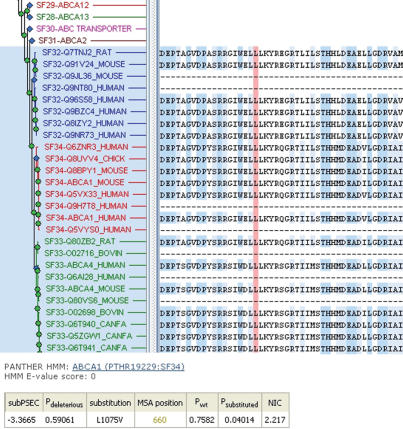
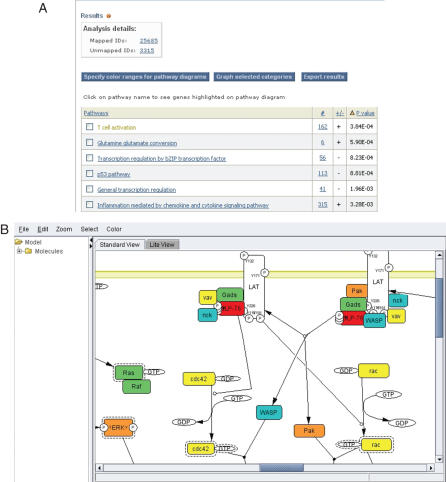
The vast amount of protein sequence data now available, together with accumulating experimental knowledge of protein function, enables modeling of protein sequence and function evolution. The PANTHER database was designed to model evolutionary sequence-function relationships on a large scale. There are a number of applications for these data, and we have implemented web services that address three of them. The first is a protein classification service. Proteins can be classified, using only their amino acid sequences, to evolutionary groups at both the family and subfamily levels. Specific subfamilies, and often families, are further classified when possible according to their functions, including molecular function and the biological processes and pathways they participate in. The second application, then, is an expression data analysis service, where functional classification information can help find biological patterns in the data obtained from genome-wide experiments. The third application is a coding single-nucleotide polymorphism scoring service. In this case, information about evolutionarily related proteins is used to assess the likelihood of a deleterious effect on protein function arising from a single substitution at a specific amino acid position in the protein. All three web services are available at http://www.pantherdb.org/tools.


Figures

Figure 1
Figure 1
Viewing data underlying statistical analysis of gene lists with respect to function. The data are from Cho et al. (16); each list comprises genes up-regulated at a given stage of the human cell cycle. (A) Overlay chart of four datasets (M, G1, S and G2 phases of cell cycle): logarithm of fold differences (compared with reference list) of the numbers of genes in each biological process category. Each dataset is shown in a different color (G1 blue, S magenta, G2 green, M light blue); statistically significant differences are indicated with an asterisk. (B) Multiple pie chart of the biological processes represented in the reference list (left) versus the list of genes up-regulated during G1 phase (right). Mousing over a pie slice shows details about the comparison with the reference list; in this example, among the genes up-regulated in G1 (right) there are many more genes involved in DNA replication than expected by chance (the same color slice in the reference list at left).
Figure 2
Figure 2
Graphical view of the evolutionary data used to calculate coding SNP scores. The multiple sequence alignment of UniProt sequences (right) is displayed next to the protein family tree that shows the relationships between functionally distinct subfamilies. In this example, the uploaded sequence was for the product of the ABCA1 gene (RefSeq NP_005493), for the mutation L1075V. The column corresponding to the substituted amino acid is highlighted in red, and the subfamilies (ABCA1, ABCA4, ABCA7) used to calculate the score Pdeleterious are expanded in the tree view on the left. See text for more details. The user can expand and collapse tree nodes by clicking on any node (green circles or blue diamonds indicating subfamily nodes). Other subfamilies (e.g. ABCA2, ABCA12, ABCA13) are shown collapsed here.
Figure 3
Figure 3
Expression data analysis and visualization on the PANTHER website. (A) Mann–Whitney U-test results, and (B) CellDesigner (15) diagram of the T-cell activation signaling pathway from the PANTHER Pathway database (accession P00053, author Adam Douglass). This applet colors proteins according to a ‘heat map’ calculated from user-input values. Protein components are mapped to PANTHER HMMs. Active forms (dashed-line boxes) and phosphorylated forms (small circles around the letter ‘P’) of proteins are clearly indicated in the diagram. A total of 107 pathways (mostly signaling pathways) are currently available.

References

    1. Thomas P.D., Campbell M.C., Kejariwal A., Mi H., Karlak B., Daverman R., Diemer K., Muruganujan A., Narechania A. PANTHER: a library of protein families and subfamilies indexed by function. Genome Res. 2003;13:2129–2141. - PMC - PubMed
    1. Mi H., Lazareva-Ulitsky B., Loo R., Kejariwal A., Vandergriff J., Rabkin S., Guo N., Muruganujan A., Doremieux O., Campbell M.J., et al. The PANTHER database of protein families, subfamilies, functions and pathways. Nucleic Acids Res. 2005;33:D284–D288. - PMC - PubMed
    1. Eddy S.R. Hidden Markov models. Curr. Opin. Struct. Biol. 1996;6:361–365. - PubMed
    1. Gene Ontology Consortium. Gene ontology: tool for the unification of biology. Nat. Genet. 2000;25:25–29. - PMC - PubMed
    1. Pruitt K.D., Maglott D.R. RefSeq and LocusLink: NCBI gene-centered resources. Nucleic Acids Res. 2001;29:137–140. - PMC - PubMed

Publication types

MeSH terms