. 2006;34(14):3887-96.
doi: 10.1093/nar/gkl529. Epub 2006 Aug 10.

Gene function correlates with potential for G4 DNA formation in the human genome

Affiliations

Gene function correlates with potential for G4 DNA formation in the human genome

Johanna Eddy et al. Nucleic Acids Res. 2006.

Abstract

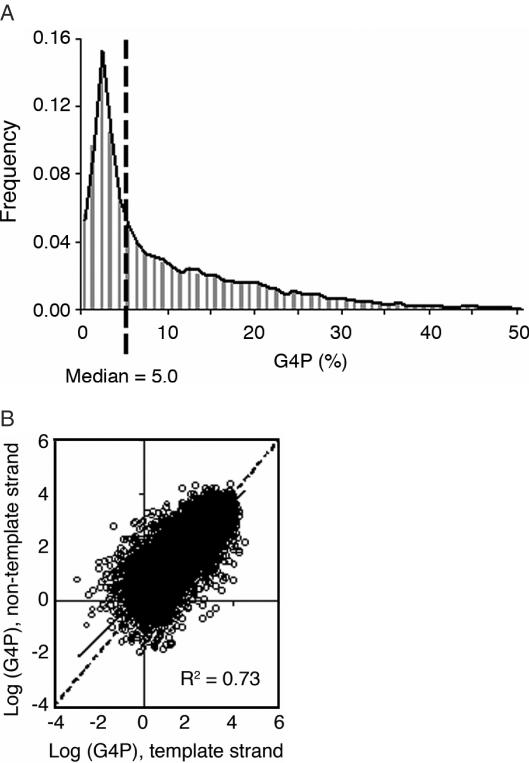
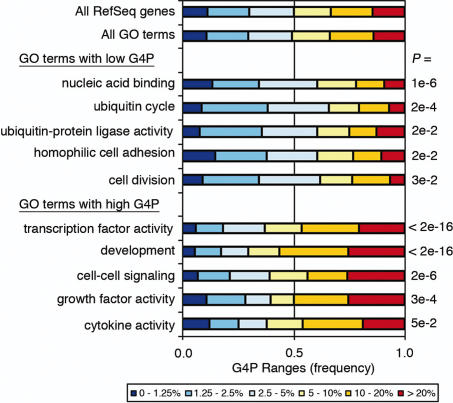
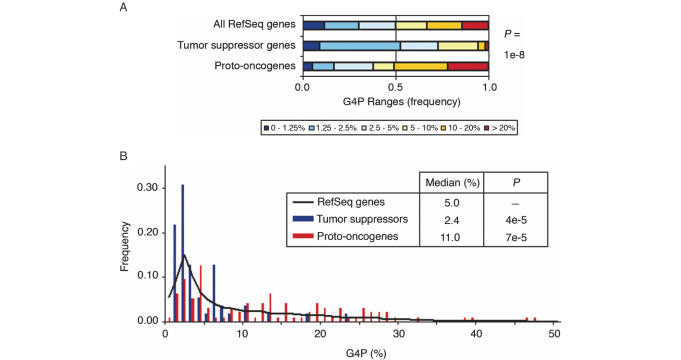
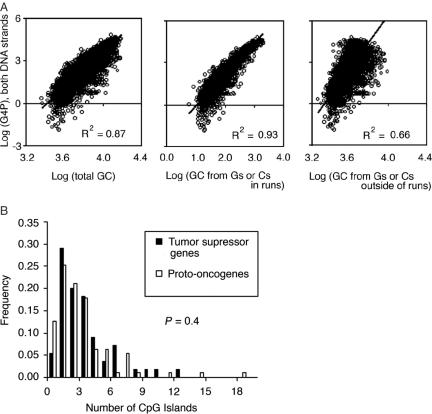
G-rich genomic regions can form G4 DNA upon transcription or replication. We have quantified the potential for G4 DNA formation (G4P) of the 16 654 genes in the human RefSeq database, and then correlated gene function with G4P. We have found that very low and very high G4P correlates with specific functional classes of genes. Notably, tumor suppressor genes have very low G4P and proto-oncogenes have very high G4P. G4P of these genes is evenly distributed between exons and introns, and it does not reflect enrichment for CpG islands or local chromosomal environment. These results show that genomic structure undergoes selection based on gene function. Selection based on G4P could promote genomic stability (or instability) of specific classes of genes; or reflect mechanisms for global regulation of gene expression.


Figures

Figure 1
Figure 1
Potential for G4 DNA formation of human genes. (A) Distribution of genes across G4 DNA formation potential (G4P). The distribution of 16 654 RefSeq genes is illustrated by vertical bars (gray). Median G4P for the RefSeq genes at 5.0% is indicated by a dotted line. The distribution of the 4396 GO terms assigned to 73% of the RefSeq genes is outlined (black). (B) Positive correlation of G4P of template and nontemplate DNA strands. Linear regression analysis of G4P of the nontemplate (y-axis) and the template (x-axis) strand. Owing to the skewed distribution of G4P, the data were subjected to a natural log transformation before linear regression analysis; therefore, a small number of genes with G4P equal to zero were not included. The slope determined by linear regression analysis (0.83) is represented by the solid line; and slope of unity by the dotted line.
Figure 2
Figure 2
G4P correlates with gene function. Ranges of G4P for all RefSeq genes (top line) compared with five GO terms overrepresented in low or high G4P. Boxes represent the percentage of genes in each GO category characterized by G4P in the range 0–1.25, 1.25–2.5, 2.5–5.0, 5–10, 10–20% and >20% (colors as indicated). P-values shown on the right represent significance of the difference in distribution between each GO term and the RefSeq genes, as calculated by the Wilcoxon rank sum test.
Figure 3
Figure 3
Contrasting G4P of tumor suppressor genes and proto-oncogenes. (A) Ranges of G4P for 55 tumor suppressor genes, 95 proto-oncogenes and all 16 654 RefSeq genes. Boxes represent the percentage of genes in each category characterized by G4P in the range 0–1.25, 1.25–2.5, 2.5–5.0, 5–10, 10–20% and >20% (colors as indicated). P-value represents significance of the difference in distribution between the tumor suppressor genes and proto-oncogenes, as calculated by the Wilcoxon rank sum test. (B) Distribution of tumor suppressor genes and proto-oncogenes across G4P. Bars represent the G4P distribution of 55 tumor suppressor genes (blue) and 95 proto-oncogenes (red). The black outline diagrams distribution of all 16 654 RefSeq genes (as in Figure 1A). P-values represent significance of the difference in distribution between each group of genes and the RefSeq genes, as calculated by the Wilcoxon rank sum test.
Figure 4
Figure 4
G4P correlates with GC-content but not CpG islands. (A) Correlation of G4P with GC-content. Linear regression analysis of G4P relative to total GC-content (left); the portion of GC-content contributed from G-runs or C-runs (center); the remaining GC-content contributed from Gs and Cs outside of G-runs or C-runs (right). The data were subjected to a natural log transformation before linear regression analysis; therefore, a small number of genes with G4P equal to zero were not included. The slopes determined by linear regression analysis are represented by solid lines. G4P correlates most closely with Gs and Cs within runs (middle). (B) Distribution of tumor suppressor genes and proto-oncogenes relative to number of CpG islands. Closed bars, tumor suppressor genes; open bars, proto-oncogenes. P-value was determined by the Wilcoxon rank sum test comparing tumor suppressor genes to proto-oncogenes, and shows that there is not a significant relationship between gene function and number of CpG islands.
Figure 5
Figure 5
Differences in G4P of tumor suppressor and proto-oncogene cDNAs. Distribution of tumor suppressor gene and proto-oncogene cDNA sequences across G4P. Bars represent tumor suppressor genes (closed bars) and proto-oncogenes (open bars). P-value was determined from the Wilcoxon rank sum test comparing tumor suppressor genes to proto-oncogenes.
Figure 6
Figure 6
G4P of genes differs from G4P of genomic environment. Average G4P for genes; 20 kb flanking sequences (G4PFLANK); and ΔG4P, the difference between G4P for each gene and its flank. Gray bars, RefSeq genes; closed bars, tumor suppressor genes; and open bars, proto-oncogenes. Standard errors were determined by ANOVA for each analysis of the three groups of genes.

References

    1. Sen D., Gilbert W. Formation of parallel four-stranded complexes by guanine-rich motifs in DNA and its implications for meiosis. Nature. 1988;334:364–366. - PubMed
    1. Gellert M., Lipsett M.N., Davies D.R. Helix formation by guanylic acid. Proc. Natl Acad. Sci. USA. 1962;48:2013–2018. - PMC - PubMed
    1. Phan A.T., Kuryavyi V., Patel D.J. DNA architecture: from G to Z. Curr. Opin. Struct. Biol. 2006;16:288–298. - PMC - PubMed
    1. Hazel P., Parkinson G.N., Neidle S. Predictive modelling of topology and loop variations in dimeric DNA quadruplex structures. Nucleic Acids Res. 2006;34:2117–2127. - PMC - PubMed
    1. Huppert J.L., Balasubramanian S. Prevalence of quadruplexes in the human genome. Nucleic Acids Res. 2005;33:2908–2916. - PMC - PubMed

Publication types