. 2006 Nov;17(11):4593-605.
doi: 10.1091/mbc.e06-05-0377. Epub 2006 Aug 16.

The mitochondrial fission protein hFis1 requires the endoplasmic reticulum gateway to induce apoptosis

Affiliations

The mitochondrial fission protein hFis1 requires the endoplasmic reticulum gateway to induce apoptosis

Emilie Alirol et al. Mol Biol Cell. 2006 Nov.

Abstract

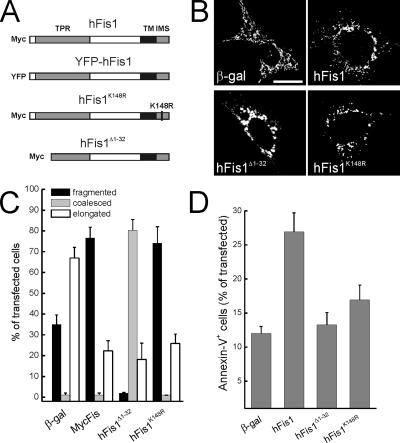
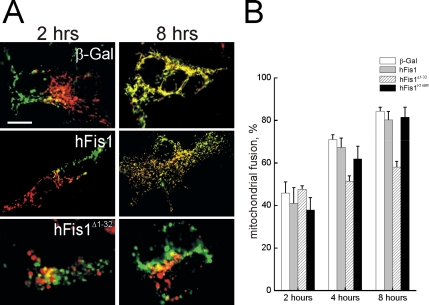
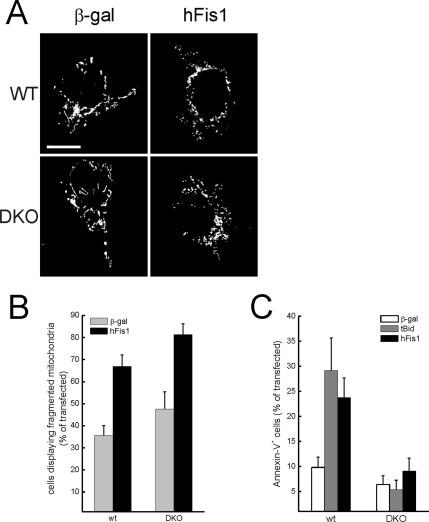
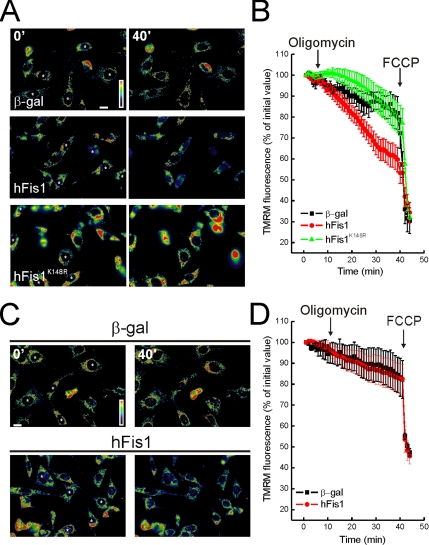
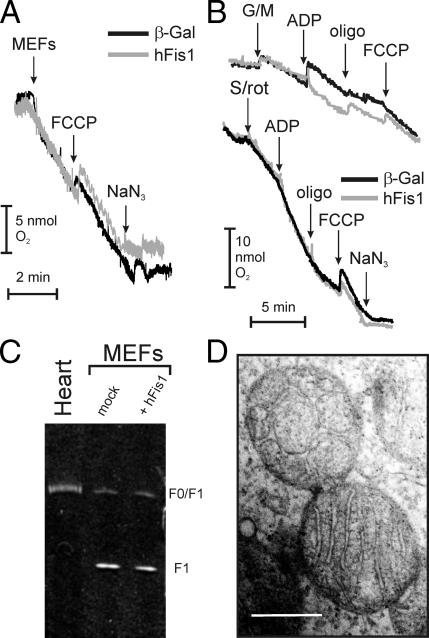
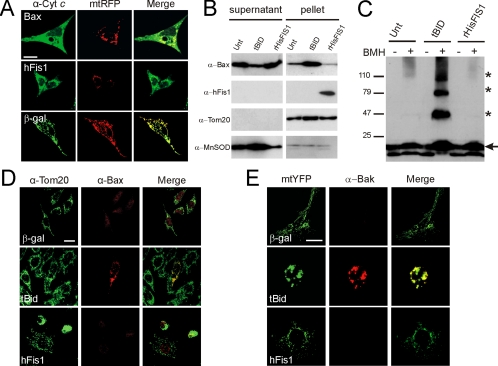
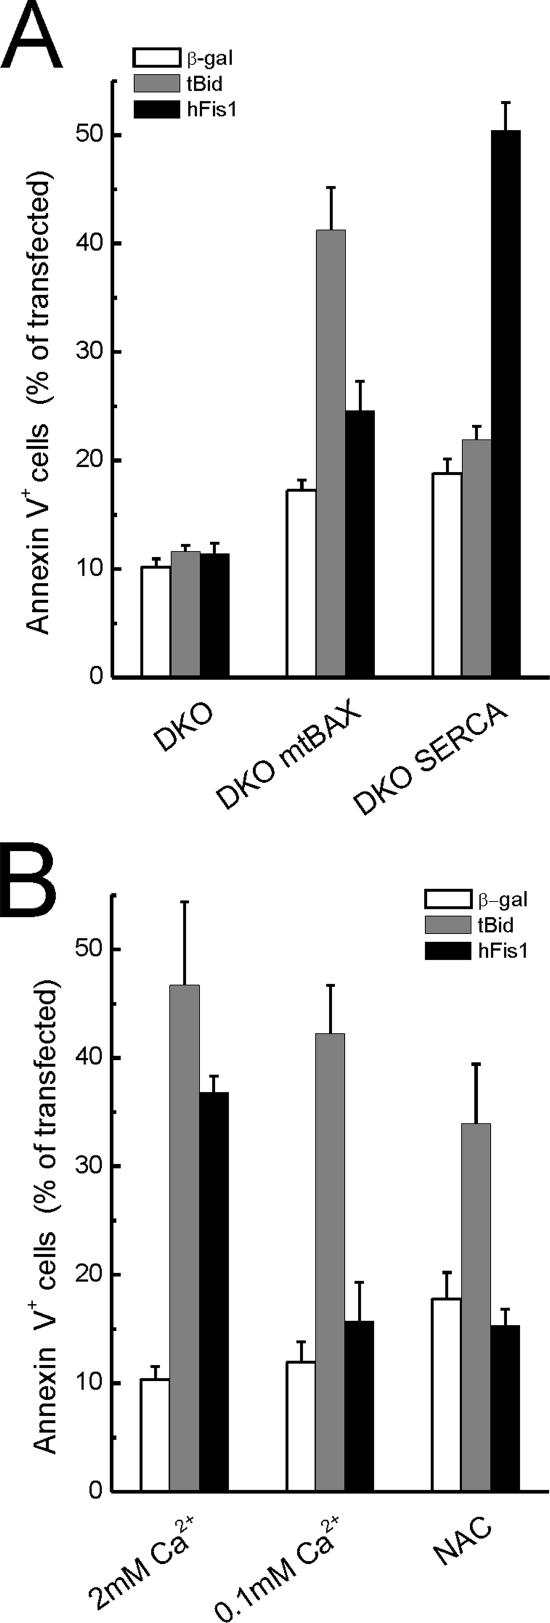
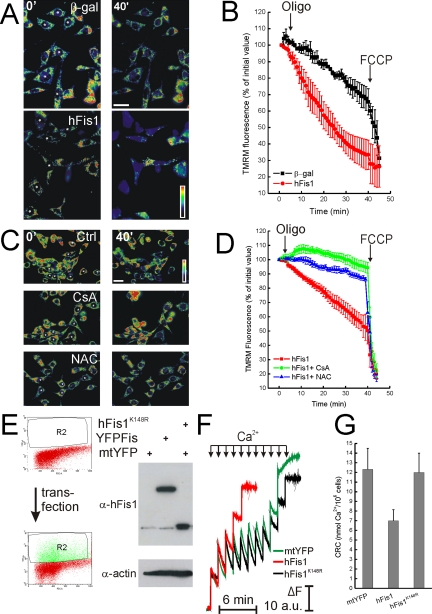
Mitochondrial fission ensures organelle inheritance during cell division and participates in apoptosis. The fission protein hFis1 triggers caspase-dependent cell death, by causing the release of cytochrome c from mitochondria. Here we show that mitochondrial fission induced by hFis1 is genetically distinct from apoptosis. In cells lacking the multidomain proapoptotic Bcl-2 family members Bax and Bak (DKO), hFis1 caused mitochondrial fragmentation but not organelle dysfunction and apoptosis. Similarly, a mutant in the intermembrane region of hFis1-induced fission but not cell death, further dissociating mitochondrial fragmentation from apoptosis induction. Selective correction of the endoplasmic reticulum (ER) defect of DKO cells restored killing by hFis1, indicating that death by hFis1 relies on the ER gateway of apoptosis. Consistently, hFis1 did not directly activate BAX and BAK, but induced Ca(2+)-dependent mitochondrial dysfunction. Thus, hFis1 is a bifunctional protein that independently regulates mitochondrial fragmentation and ER-mediated apoptosis.


Figures

Figure 1.
Figure 1.
Mutational analysis of hFis1 domains required for mitochondrial fission and apoptosis. (A) Cartoon of constructs used in this study. (B) Representative images of mitochondrial morphology in wt MEFs cotransfected with the indicated plasmid and mtRFP. Forty-eight hours after transfection fluorescence of mtRFP was visualized by confocal microscopy. Bar 15, μm. (C) Morphometric analysis of mitochondrial shape. Experiments were carried exactly as in A. Data represent mean ± SE of five different experiments. (D) Deletion of the first α-helix and K148R point mutation abolish hFis1-induced apoptosis. wt MEFs were cotransfected with GFP and the indicated plasmids, and after 48 h apoptosis was determined as the percentage of GFP-positive, Annexin-V–positive cells by flow cytometry. Data represent mean ± SE of six independent experiments.
Figure 2.
Figure 2.
hFis1 does not alter mitochondrial fusion. (A) Representative images of heteropolykaryons after PEG-induced cell fusion. MEFs cotransfected with mtYFP or mtRFP and the indicated plasmids were coplated on glass coverslips, fused, and fixed at the indicated times. Confocal images of representative polykaryons are shown. Bar, 20 μm. (B) Quantification of the effects of wt and mutants of hFis1 on the mitochondrial PEG fusion assay. Experiments were carried out as in A, and cells were fixed at the indicated times. Mitochondrial fusion was evaluated as described in Materials and Methods from 30 randomly selected polykaryons. Data represent mean ± SE of three different experiments.
Figure 3.
Figure 3.
hFis1 triggers mitochondrial fission but not apoptosis in DKO MEFs. (A) Representative images of mitochondrial morphology in wt and DKO cells. wt and DKO MEFs were cotransfected with the indicated plasmid and mtRFP. Experiments were carried out exactly as in Figure 1. (B) Morphometric analysis of mitochondrial shape was carried out exactly as in Figure 1. Data represent mean ± SE of five different experiments. (C) hFis1 does not trigger cell death in DKO cells. MEFs of the indicated genotype were cotransfected with GFP and the indicated plasmids. Apoptosis was determined as in Figure 1. Data represent mean ± SE of six different experiments.
Figure 4.
Figure 4.
DKO cells are resistant to mitochondrial dysfunction induced by hFis1. (A and C) Pseudocolor-coded, representative images of TMRM fluorescence intensity in wt (A) and DKO (C) cells at 5 (5′) and 40 min (40′) of the acquisition sequence. MEFs cotransfected with GFP and the indicated plasmids (asterisks) after 24 h were loaded with TMRM and imaged as described. Oligomycin (2.5 μg/ml) was added at min 3 of the sequence. (B and D) Quantification of the TMRM fluorescence changes over mitochondrial regions in wt (B) and DKO (D) MEFs. Experiments were carried out as A and C, respectively. Quantification procedure is described in the Materials and Methods. Where indicated (arrows), oligomycin (2.5 μg/ml) and FCCP (4 μM) were added.
Figure 5.
Figure 5.
Mitochondrial respiration, ultrastructure, and ATPase activity in cells expressing hFis1. (A) Oxygen consumption in control and hFis1-expressing intact wt MEFs. Forty-eight hours after transfection, cells were harvested, and 108 cells were incubated in HBSS into an oxygen electrode chamber. Where indicated (arrows), the uncoupler FCCP (2 μM) and the complex IV inhibitor NaN3 (10 mM) were added. (B) Oxygen consumption in control and hFis1-expressing permeabilized MEFs. Experiments were as in A, except that the cells (108) were incubated in 0.5 ml EB containing 0.01% (wt/vol) digitonin. Where indicated (arrows), glutamate plus malate (G/M, 5/2.5 mM) or succinate (Succ, 5 mM in the presence of 2 μM Rotenone, an inhibitor of complex I), ADP (100 μM), oligomycin (2.5 μg/ml), FCCP (60 nM), and NaN3 (1 mM) were added. (C) In-gel activity assay of F1-ATPase. Mitochondria from hFis1-transfected and untransfected cells were isolated and solubilized in n-dodecylmaltoside. Solubilized samples were then separated by BN-PAGE as described in experimental procedures. The Blue Native gel was then histochemically stained for ATP hydrolysis activity. Mitochondria isolated from human hearth samples were loaded as a control. (D) Representative ultrastructure of mitochondria in hFis1-expressing cells. Cells transfected with hFis1 were fixed, and standard electron microsopy images were acquired as described. Bar, 100 nm.
Figure 6.
Figure 6.
hFis1 does not activate BAX and BAK. (A) hFis1 induces release of cytochrome c. wt MEFs were cotransfected with mtRFP and the indicated plasmid. After 24 h, cells were fixed and immunostained for cytochrome c, and confocal images of mtRFP and cytochrome c were acquired. Images are representative of 80 different cells in three independent experiments. Bar, 15 μm. (B) hFis1 does not trigger BAX insertion into mitochondrial membranes. Purified mitochondria (50 μg) were incubated with p7/p15 BID or with r-HisFis1. Mitochondria were then treated with 0.1 M Na2CO3, and alkali-resistant (pellet) and -sensitive fractions (supernatant) were separated by centrifugation. Proteins were separated by SDS-PAGE and immunoblotted using the indicated antibodies. (C) hFis1 does not induce BAK oligomerization. Purified mitochondria (50 μg) were incubated as in A, and proteins were cross-linked where indicated by incubating with bismaleimidohexane (BMH, 10 mM) for 15 min. Samples were separated by SDS-PAGE and immunoblotted with an anti-BAK antibody. Asterisk, BAK multimers; arrow, BAK monomer. (D) hFis1 does not trigger BAX activation in vivo. MEFs were transfected with indicated plasmids, and 48 h after transfection cells were stained for Tom20 and for activated BAX using a BAX-NT antibody and counterstained with FITC- and TRITC-conjugated isotype-matched secondary antibodies. (E) hFis1 does not trigger BAK activation in vivo. wt MEFs were cotransfected with the indicated plasmid and mtYFP. After 48 h cells were fixed and immunostained with a monoclonal anti-BAK antibody and counterstained with a TRITC-conjugated secondary antibody. Bar, 15 μM.
Figure 7.
Figure 7.
The BAX, BAK ER gateway controls death by hFis1. (A) hFis- induced apoptosis is restored in DKO-SERCA but not in DKO-mtBAX MEFs. MEFs of the indicated genotype were cotransfected with GFP and the indicated plasmids. Apoptosis was determined as the percentage of GFP-positive, Annexin-V–positive cells by flow cytometry. Data represent mean ± SE of six different experiments. (B) hFis1 induced cell death is inhibited by low extracellular [Ca2+] and by NAC. wt MEFs were transfected as in A, and after 4 h NAC (2.5 mM) was added to the media. Apoptosis was monitored 48 h after transfection. Where indicated (0.1 mM Ca2+), wt MEFs were incubated in KRB supplemented with EGTA for 3 h and then maintained in complete DMEM containing 0.1 mM Ca2 before transfection.
Figure 8.
Figure 8.
Mitochondrial dysfunction by hFis1 is mediated by permeability transition. (A and B) hFis1 induces mitochondrial dysfunction in DKO-SERCA MEFs. DKO-SERCA MEFs cotransfected with GFP, and the indicated plasmid (asterisks in A) were loaded with TMRM, and fluorescence imaging was performed as described in Figure 3. Data represent mean ± SE of three independent experiments. (C and D) Mitochondrial dysfunction induced by hFis1 is inhibited by CsA and NAC. wt MEFs cotransfected with GFP and Myc-hFis1 (asterisks in C) were loaded with TMRM in the presence of 2.5 mM NAC or 1.5 μM CsA when indicated. TMRM fluorescence over mitochondrial regions was imaged, stored, and analyzed as described in Figure 3. Where indicated (arrows in B and D), oligomycin (2.5 μg/ml) and FCCP (4 μM) were added. Data represent mean ± SE of five different experiments. (E) Cell sorting of YFP-expressing wt MEF. Twenty-four hours after transfection with YFP-hFis1 (YFPFis), mtYFP or mtYFP plus hFis1K148R (FisK148R), wt MEFs (108) were washed, harvested, and sorted as described in the Materials and Methods. Dot plot histograms of YFP fluorescence in control (top panel) and transfected (bottom panel) cells are shown. R2 indicates sorted population. Sorted cells were lysed in RIPA buffer, and equal amounts of protein (40 μg) were separated by SDS-PAGE and immunoblotted with the indicated antibodies. (F) Representative traces of mitochondrial calcium retention capacity (CRC). Sorted (5 × 10⁶) cells were permeabilized with digitonin (0.001% wt/vol) in experimental buffer, and Ca2+ uptake was measured after the fluorescence changes of the Ca2+ indicator Ca-Green. Where indicated (arrows), 5 μM Ca2+ were added. Final volume, 1 ml, pH 7.4, 37°C. (G) Quantitative analysis of CRC of mitochondria from digitoninpermeabilized cells. CRC of mitochondria of sorted wt MEFs transfected with the indicated plasmids was measured exactly as in F. Data represent mean ± SE of five different experiments.

Similar articles

Cited by

References

    1. Arnoult D., Rismanchi N., Grodet A., Roberts R. G., Seeburg D. P., Estaquier J., Sheng M., Blackstone C. Bax/Bak-dependent release of DDP/TIMM8a promotes Drp1-mediated mitochondrial fission and mitoptosis during programmed cell death. Curr. Biol. 2005;15:2112–2118. - PubMed
    1. Bernardi P. Mitochondrial transport of cations: channels, exchangers and permeability transition. Physiol. Rev. 1999;79:1127–1155. - PubMed
    1. Bossy-Wetzel E., Barsoum M. J., Godzik A., Schwarzenbacher R., Lipton S. A. Mitochondrial fission in apoptosis, neurodegeneration and aging. Curr. Opin. Cell Biol. 2003;15:706–716. - PubMed
    1. Chen H., Chomyn A., Chan D. C. Disruption of fusion results in mitochondrial heterogeneity and dysfunction. J. Biol. Chem. 2005;280:26185–26192. - PubMed
    1. Chen H., Detmer S. A., Ewald A. J., Griffin E. E., Fraser S. E., Chan D. C. Mitofusins Mfn1 and Mfn2 coordinately regulate mitochondrial fusion and are essential for embryonic development. J. Cell Biol. 2003;160:189–200. - PMC - PubMed

Publication types

MeSH terms