. 2006 Sep;26(17):6412-24.
doi: 10.1128/MCB.01950-05.

Heregulin-dependent delay in mitotic progression requires HER4 and BRCA1

Affiliations

Heregulin-dependent delay in mitotic progression requires HER4 and BRCA1

Rebecca S Muraoka-Cook et al. Mol Cell Biol. 2006 Sep.

Abstract

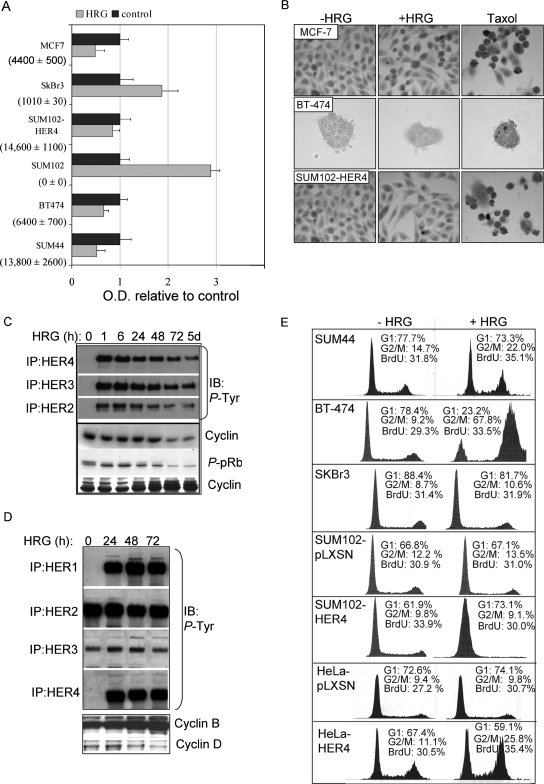
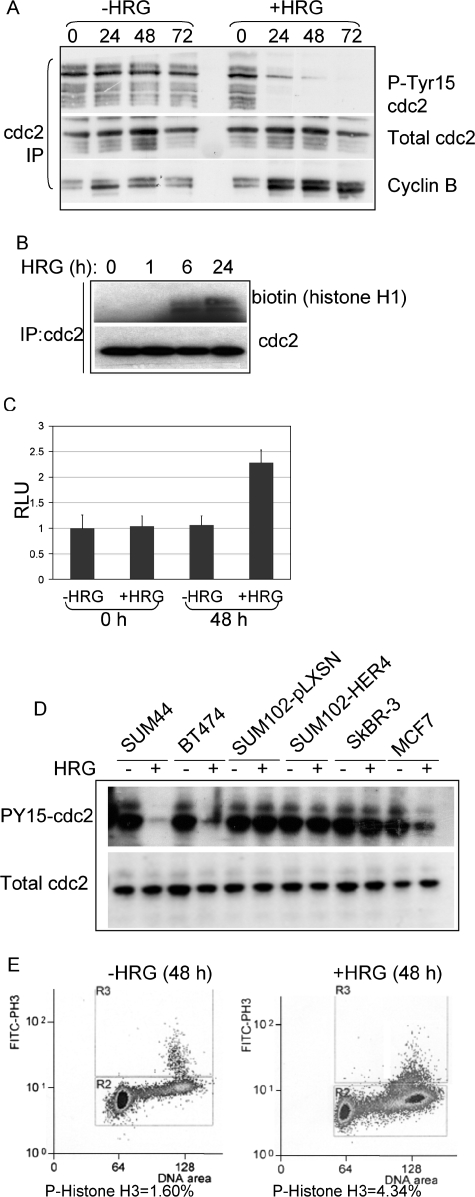
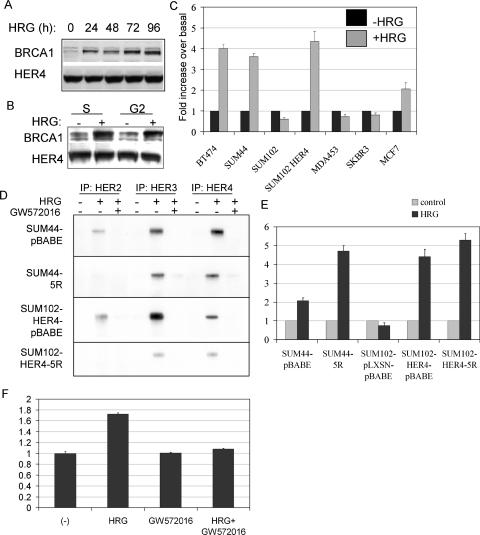
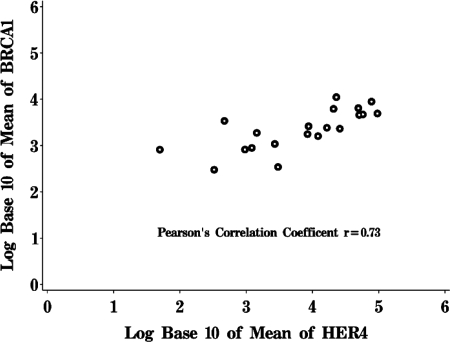
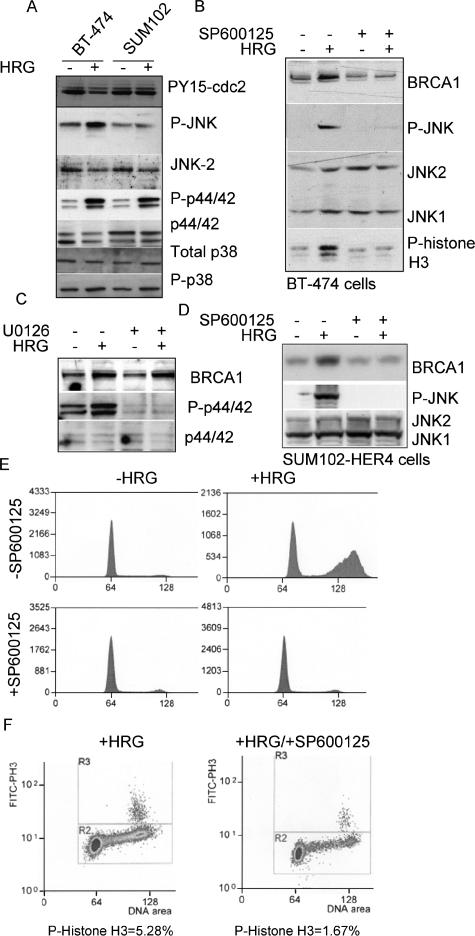
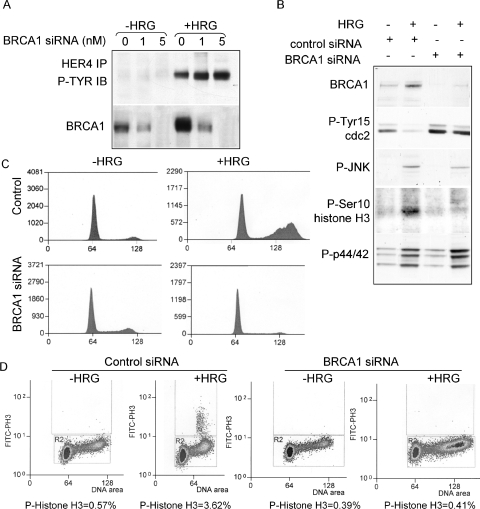
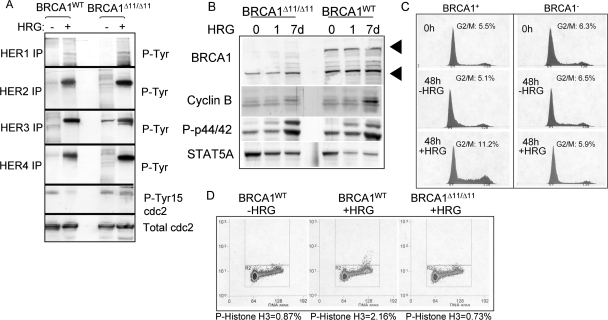
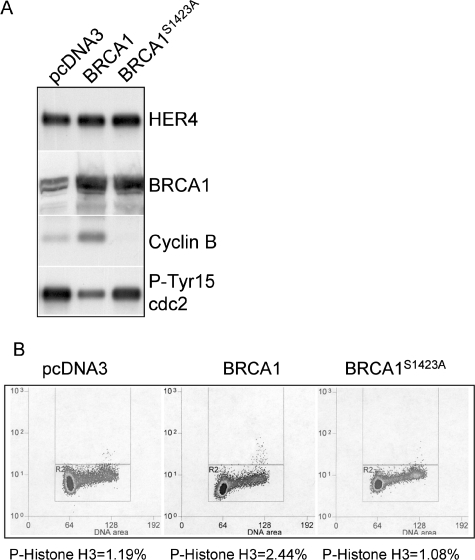
HER4 expression in human breast cancers correlates with a positive prognosis. While heregulin inhibits the growth of HER4-positive breast cancer cells, it does so by undefined mechanisms. We demonstrate that heregulin-induced HER4 activity inhibits cell proliferation and delays G(2)/M progression of breast cancer cells. While investigating pathways of G(2)/M delay, we noted that heregulin increased the expression of BRCA1 in a HER4-dependent, HER2-independent manner. Induction of BRCA1 by HER4 occurred independently of the cell cycle. Moreover, BRCA1 expression was elevated in HER4-postive human breast cancer specimens. Heregulin stimulated c-Jun N-terminal kinase (JNK), and pharmacologic inhibition of JNK impaired heregulin-enhanced expression of BRCA1 and mitotic delay; inhibition of Erk1/2 did not. Knockdown of BRCA1 with small interfering RNA in a human breast cancer cell line interfered with HER4-mediated mitotic delay. Heregulin/HER4-dependent mitotic delay was examined further with an isogenic pair of mouse mammary epithelial cells (MECs) derived from mice harboring homozygous LoxP sites flanking exon 11 of BRCA1, such that one cell line expressed BRCA1 while the other cell line, after Cre-mediated excision, did not. BRCA1-positive MECs displayed heregulin-dependent mitotic delay; however, the isogenic BRCA1-negative MECs did not. These results suggest that heregulin-mediated growth inhibition in HER4-postive breast cancer cells requires BRCA1.


Figures

FIG. 1.
FIG. 1.
HRG-mediated growth inhibition requires HER4 expression. (A) Absolute levels of HER4 mRNA transcripts were measured by quantitative real-time RT-PCR and are shown for each cell line in parentheses (average number of transcripts ± standard deviation [SD]; n = 3). Equal numbers of cells from each cell line were plated and cultured for 48 h with or without HRG; relative cell numbers were determined by using the MTS assay, which converts cell density to optical density (OD). The values represent the average OD ± SD, represented as a ratio to the OD produced by cells grown in the absence of HRG. Each experiment was performed in triplicate and repeated three times. (B) In situ TUNEL analysis of HRG-treated MCF-7, BT-474, and SUM44 cells treated with or without HRG for 0 to 48 h. (C and D) Western analysis of whole-cell extracts or HER1, HER2, HER3, and HER4 immunoprecipitates from SUM44 cells (C) or BT-474 cells (D), treated with HRG for the indicated time courses, to detect the expression of cyclin D, cyclin B, or phospho-pRb or phosphotyrosine residues. (E) Cell cycle analysis of cells cultured in serum-free medium with or without HRG for 72 h. The percentages of the cell population in the G1 and G2/M phases of the cell cycle are shown. In addition, cells were labeled with BrdU for 6 h, stained with an FITC-conjugated anti-BrdU antibody, and analyzed by flow cytometry. The percentages of BrdU-positive cells are indicated. A total of >10,000 nuclei per sample were counted (n = 3).
FIG. 2.
FIG. 2.
HRG delays progression through mitosis. (A) Western analysis of cdc2 immunoprecipitates from whole-cell extracts of SUM44 cells cultured with or without HRG for 0 to 72 h, detecting total cdc2, phosphotyrosine 15 cdc2, or coprecipitation of cyclin B. (B) In vitro kinase activity of cdc2 immunoprecipitates from SUM44 cells cultured in the presence of HRG for 0 to 24 h. cdc2 immunoprecipitates were divided. One-half was analyzed by Western analysis for total levels of cdc2; the other half was used in the cdc2 kinase assay, directing phosphorylation against a fragment of histone H1. (C) Quantification of a luciferase-linked in vitro cdc2 kinase assay (Promega), with luciferase activity measured in relative light units (RLU). Cells were cultured for 0 or 48 h with or without HRG, and cdc2 was immunoprecipitated from 500 μg whole-cell extract to be used directly in each reaction. Results are presented as the average relative light units per sample ± SD (n = 3). (D) Western analysis to detect phosphotyrosine 15 cdc2 and total cdc2 in cdc2 immunoprecipitates from a series of cell lines cultured with or without HRG for 48 h. (E) FACS analysis of BT-474 cells treated with or without HRG for 0 or 48 h. Methanol-fixed cells were stained with an antibody against phospho-histone H3 (and an FITC-labeled secondary antibody) and with propidium iodide. A total of >20,000 cells were analyzed by flow cytometry. The percentage of cells that were positive for FITC is shown below each panel.
FIG. 3.
FIG. 3.
HRG results in increased expression of BRCA1 in HER4-positive cells. (A) Western analysis of whole-cell extracts from BT-474 cells cultured with HRG for 0 to 96 h, detecting BRCA1 and HER4. (B) BT-474 cells were cultured with or without HRG for 48 h in the presence of hydroxyurea (to synchronize cells in S phase) or olomoucine (a cdc2/cdk1 inhibitor that synchronizes cells in late G2). Whole-cell lysates were analyzed by Western analysis to detect BRCA1 or HER4. (C) Expression of BRCA1 mRNA was measured using real-time quantitative RT-PCR. Each cell line was grown in serum-free medium plus insulin and hydrocortisone, with or without HRG, for 24 h. The BRCA1 transcript level in total RNA (10 ng) was assessed by qPCR as described in Materials and Methods. Comparison to a BRCA1 standard allowed quantitation of transcript numbers. The average number (± SD) is represented as a ratio to that in untreated controls, assigned the value of 1 (n = 3). (D) Western analysis of HER2, HER3, and HER4 immunoprecipitates from cells cultured with or without HRG and with or without the ErbB-specific small-molecule inhibitor GW572016. 5R cells express an intracellular antibody that eliminates HER2 surface expression. Immunoprecipitates were analyzed by Western blotting to detect phosphotyrosine residues. (E) Expression of BRCA1 mRNA was measured by real-time quantitative RT-PCR. Each cell line was grown in serum-free medium plus insulin and hydrocortisone, with or without HRG, for 24 h. Total RNA (10 ng) was analyzed as noted above (n = 3). The number of BRCA1 transcripts in each untreated cell line was given a value of 1, and the number of BRCA1 transcripts in the HRG-treated cell line (24 h of HRG treatment) is given relative to that in the control. Experiments were repeated three times, with each sample analyzed in triplicate. (F) Expression of BRCA1 mRNA was measured by real-time quantitative RT-PCR (as described above) in SUM44 cells cultured with or without HRG (24 h) in the presence or absence of the ErbB tyrosine kinase inhibitor GW572016 (1 μM). Experiments were analyzed in triplicate and repeated three times.
FIG. 4.
FIG. 4.
HER4-positive breast tumors express greater amounts of BRCA1 than HER4-negative breast tumors. RNAs extracted from frozen breast cancer specimens were used to measure the absolute levels of HER4 and BRCA1 mRNAs by quantitative real-time RT-PCR. Each sample was analyzed independently three times. The figure shows a Pearson's correlation plot, comparing absolute levels of BRCA1 mRNA to those of HER4.
FIG. 5.
FIG. 5.
BRCA1 induction and growth inhibition in response to HRG requires JNK activity. (A) Western analysis of whole-cell extracts of BT-474 or SUM102 cells treated with or without HRG for 48 h. Antibodies used for Western analysis are shown to the right. Results shown are representative of three experiments. (B) Western analysis of BT-474 cells cultured for 48 h with or without HRG and with or without SP600125 (a small-molecule pan-JNK inhibitor). Antibodies used for Western analysis are shown to the right. (C) Western analysis of BT-474 cells cultured for 48 h with or without HRG and with or without U0126 (a small-molecule p44/42 inhibitor). Antibodies used for Western analysis are shown to the right. (D) Western analysis of SUM102-HER4 cells cultured for 48 h with or without HRG and with or without SP600125 (a small-molecule pan-JNK inhibitor). Antibodies used for Western analysis are shown to the right. (E) Cell cycle analysis of propidium iodide-stained BT-474 cells cultured for 48 h with or without HRG and with or without SP600125. (F) FACS analysis of BT-474 cells treated with HRG and with or without SP600125 for 48 h. Methanol-fixed cells were stained with an antibody against phospho-histone H3 (and an FITC-labeled secondary antibody) and with propidium iodide. A total of >20,000 cells were analyzed by flow cytometry. The percentage of cells that were positive for FITC is shown below each panel.
FIG. 6.
FIG. 6.
BRCA1 expression is required for HRG-mediated growth inhibition in BT-474 cells. (A) Western analysis of BT-474 cells transfected with increasing concentrations of BRCA1 siRNA sequences and treated with or without HRG. Cells were collected at 30 h posttransfection. (Top) Western analysis of HER4 immunoprecipitates from whole-cell extracts to detect phosphotyrosine residues. (Bottom) Western analysis of whole-cell extracts to detect BRCA1. (B) Western analysis of whole-cell lysates from BT-474 cells transfected with 10 nM BRCA1 or control siRNA and treated with or without HRG. Lysates were collected 30 h after transfection. Antibodies used for Western analysis are shown to the left of the panel. (C) Cell cycle analysis of propidium iodide-stained BT-474 cells transfected with 10 nM BRCA1 or control siRNA and treated with or without HRG. Cells were collected after 30 h. A total of >10,000 nuclei were counted per sample. (D) FACS analysis of BT-474 cells transfected with control or BRCA1 siRNA and then treated with HRG and with or without SP600125 for 36 h. Methanol-fixed cells were stained with an antibody against phospho-histone H3 (and an FITC-labeled secondary antibody) and with propidium iodide. A total of >20,000 cells were analyzed by flow cytometry. The percentage of cells that were positive for FITC is shown below each panel.
FIG. 7.
FIG. 7.
Growth of BRCA1-deficient mammary epithelial cells is not inhibited by HRG. (A) Mouse mammary epithelial cells carrying a targeted deletion of exon 11 of the BRCA1 gene (BRCA1) and their congenic wild-type counterparts (BRCA1+) were cultured for 0 to 7 days with or without HRG. (Top panels) Western analysis of HER4 immunoprecipitates to detect tyrosine phosphorylation. (Bottom panels) Western analysis of whole-cell lysates. Antibodies used for analysis are shown to the left of each panel. (B) Cells were grown with or without HRG for 0, 1, or 7 days in serum-free medium. Cells were collected and analyzed by Western analysis using the antibodies indicated to the left. (C) Analysis of propidium iodide-stained cells by flow cytometry. BRCA1WT and BRCA1Δ11/Δ11 cells were treated with or without HRG for 0 or 48 h prior to analysis. (D) FACS analysis of BRCA1+ and BRCA1 MECs treated with or without HRG for 7 days. Methanol-fixed cells were stained with an antibody against phospho-histone H3 (and an FITC-labeled secondary antibody) and with propidium iodide. A total of >20,000 cells were analyzed by flow cytometry. The percentage of cells that were positive for FITC is shown below each panel.
FIG. 8.
FIG. 8.
Overexpression of BRCA1 is sufficient to induce mitotic delay in the absence of HRG. (A) Western analysis of lysates from BT-474 cells stably transfected with pcDNA3, pcDNA3-BRCA1, or pcDNA3S1423A (defective in G2/M checkpoint induced by ionizing radiation). Cells were cultured in serum-free medium for 16 h prior to analysis. Antibodies used for Western analysis are shown to the right. (B) FACS analysis of BT-474 pcDNA3-, pcDNA3-BRCA1-, or pcDNA3S1423A-expressing cells grown in serum-free medium for 16 h, fixed in methanol, and stained with a phosphoserine 10 histone H3 antibody. The percentage of cells positive for phospho-histone H3 is shown below each panel (n > 20,000 cells).

Similar articles

Cited by

References

    1. Abd El-Rehim, D. M., S. E. Pinder, C. E. Paish, J. A. Bell, R. S. Rampaul, R. W. Blamey, J. F. Robertson, R. I. Nicholson, and I. O. Ellis. 2004. Expression and co-expression of the members of the epidermal growth factor receptor (EGFR) family in invasive breast carcinoma. Br. J. Cancer 91:1532-1542. - PMC - PubMed
    1. Alimandi, M., A. Romano, M. C. Curia, R. Muraro, P. Fedi, S. A. Aaronson, P. P. Di Fiore, and M. H. Kraus. 1995. Cooperative signaling of ErbB3 and ErbB2 in neoplastic transformation and human mammary carcinomas. Oncogene 10:1813-1821. - PubMed
    1. Altiok, S., D. Batt, N. Altiok, A. Papautsky, J. Downward, T. M. Roberts, and H. Avraham. 1999. Heregulin induces phosphorylation of BRCA1 through phosphatidylinositol 3-kinase/AKT in breast cancer cells. J. Biol. Chem. 274:32274-32278. - PubMed
    1. Arasada, R. R., and G. Carpenter. 2005. Secretase-dependent tyrosine phosphorylation of Mdm2 by the ErbB-4 intracellular domain fragment. J. Biol. Chem. 280:30783-30787. - PubMed
    1. Bobrow, L. G., R. R. Millis, L. C. Happerfield, and W. J. Gullick. 1997. c-erbB-3 protein expression in ductal carcinoma in situ of the breast. Eur. J. Cancer 33:1846-1850. - PubMed

Publication types

MeSH terms