. 2006 Sep;26(17):6584-97.
doi: 10.1128/MCB.00754-06.

FBPs are calibrated molecular tools to adjust gene expression

Affiliations

FBPs are calibrated molecular tools to adjust gene expression

Hye-Jung Chung et al. Mol Cell Biol. 2006 Sep.

Abstract

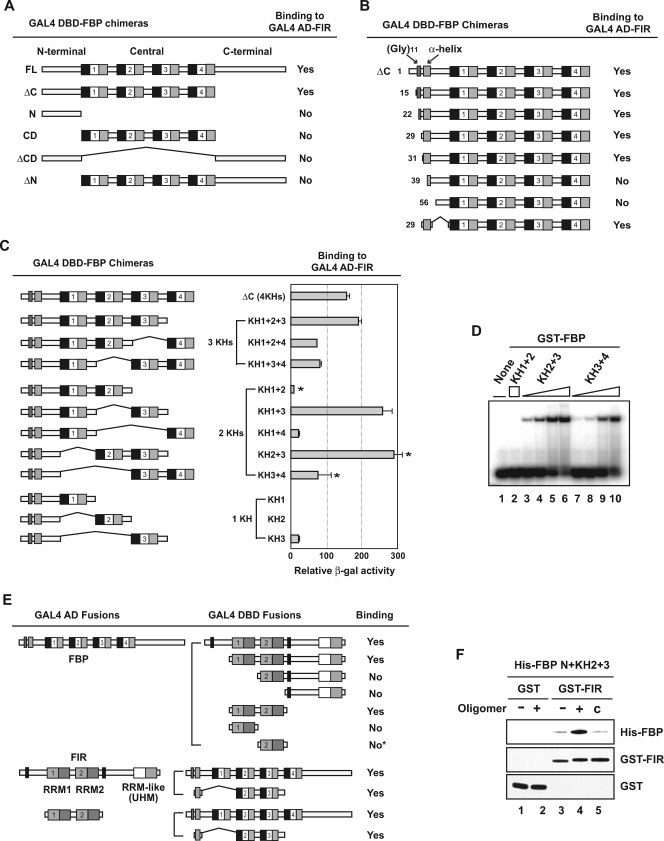
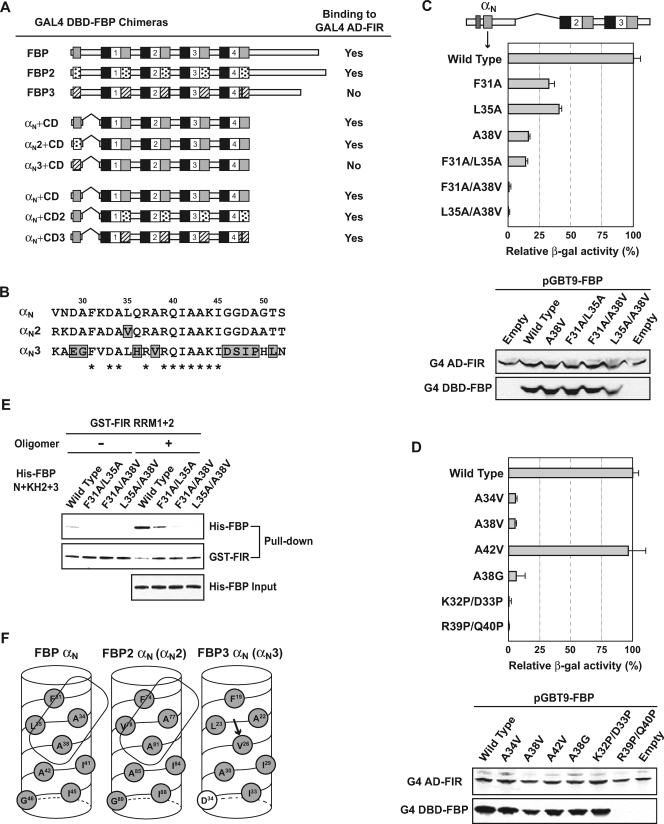
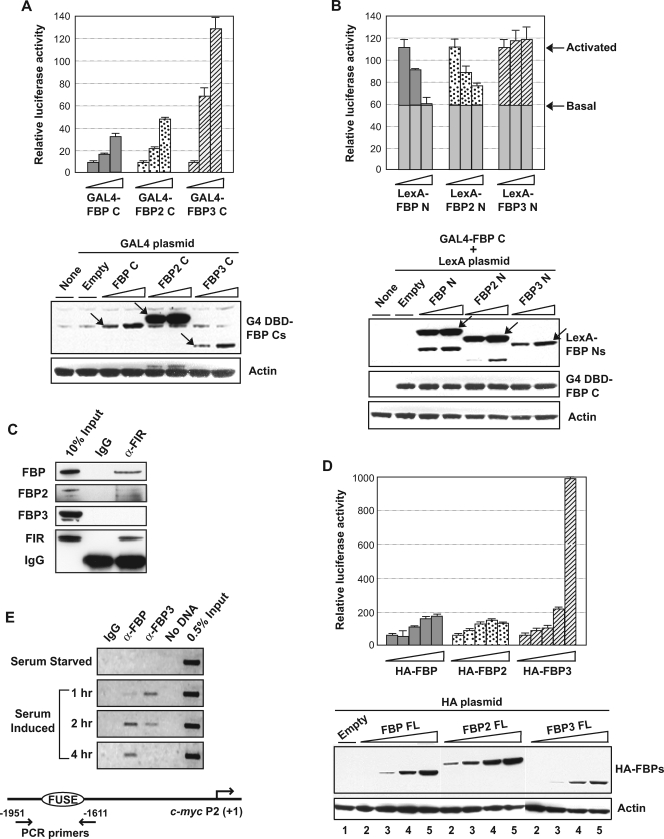
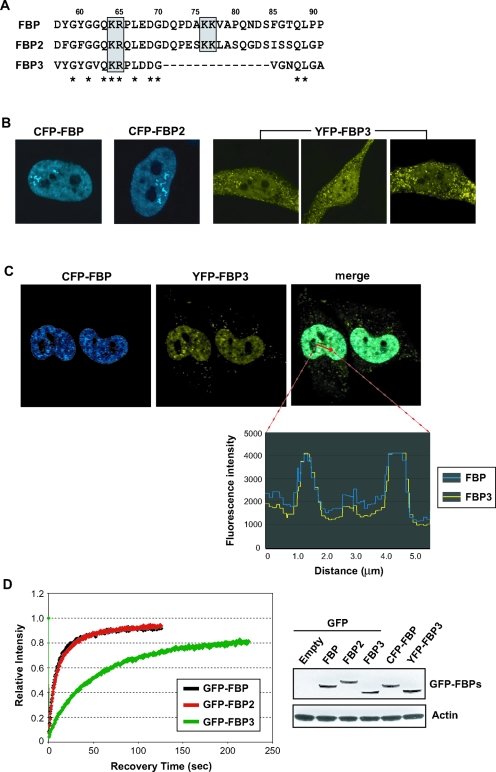
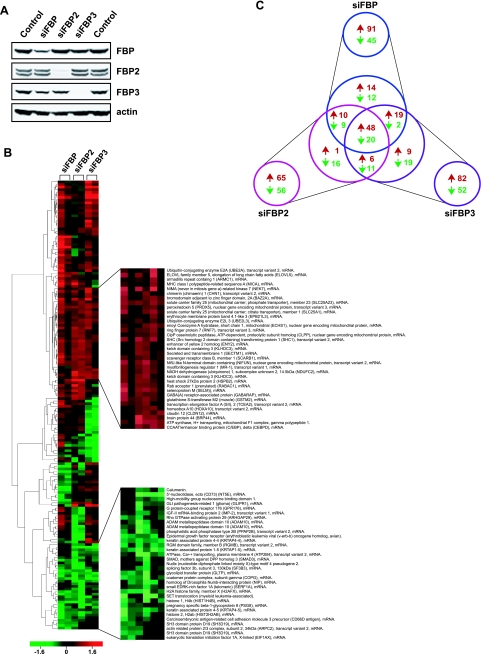
The three far-upstream element (FUSE) binding protein (FBP) family members have been ascribed different functions in gene regulation. They were therefore examined with various biochemical, molecular biological, and cell biological tests to evaluate whether their sequence differences reflect functional customization or neutral changes at unselected residues. Each FBP displayed a characteristic profile of intrinsic transcription activation and repression, binding with protein partners, and subcellular trafficking. Although some differences, such as weakened FBP3 nuclear localization, were predictable from primary sequence differences, the unexpected failure of FBP3 to bind the FBP-interacting repressor (FIR) was traced to seemingly conservative substitutions within a small patch of an N-terminal alpha-helix. The transactivation strength and the FIR-binding strength of the FBPs were in the opposite order. Despite their distinguishing features and differential activities, the FBPs traffic to shared subnuclear sites and regulate many common target genes, including c-myc. Though a variety of functions have been attributed to the FBPs, based upon their panel of shared and unique features, we propose that they constitute a molecular regulatory kit that tunes the expression of shared targets through a common mechanism.


Figures

FIG. 1.
FIG. 1.
Noncontiguous segments of FBP bind FIR. (A) FBP needs both the N-terminal domain and the central domain to bind FIR. Yeast strain SFY526 was cotransformed with pGAD-FIR and the indicated pGBT-FBP constructs, which express GAL4 AD-FIR full-length (FL) and GAL4 DBD-FBP chimeras, respectively. The binding of each pair was monitored by a β-galactosidase assay. Four KH subdomains in the FBP central domain are shown as repeated units of a black box (KH repeat), an open box (spacer), and a gray box (amphipathic α-helix). (B) The α-helix region is the necessary and sufficient feature in the FBP N-terminal domain for FIR binding. A nested deletion series from the N terminus of pGBT-FBP ΔC was cotransformed with pGAD-FIR. The number of each starting amino acid is shown on the left. A direct repeat of 11 glycine residues is indicated in addition to the predicted α-helix-forming region. (C) Different KH domains confer different FIR-binding strengths to the FBP N-terminal domain. pGBT-FBPs containing the full N-terminal domain and the indicated combinations of KH domains were compared for FIR binding using a quantitative β-Gal assay. The three two-KH domain pairs selected for further analysis by EMSA in panel D are marked with asterisks. (D) The DNA binding affinities of different KH domain combinations parallel FIR binding. Ten femtomoles of single-stranded c-myc FUSE 52-mer was incubated with 250 fmol of GST-FBP KH1+2 (lane 2) or with 10, 25, 100, or 250 fmol of GST-FBP KH2+3 (lanes 3 to 6) or GST-FBP KH3+4 (lanes 7 to 10). (E) FBP interacts with the two stereotypical RRM domains of FIR. The indicated parts of FIR were fused to the GAL4 DBD and tested using yeast two-hybrid and β-Gal assays with GAL4 AD-FBP FL (upper half). This result was confirmed by switching the AD-DBD pair combination (lower half). The asterisk indicates that FIR RRM2 alone still displayed, although very weakly, β-Gal activity that was detectable above the background level. Two Ala-rich regions on FIR are shown as black boxes, and three RRM or RRM-like domains are shown as pairs of boxes. The well-conserved RNP2 and RNP1 motifs in RRM1 and RRM2 are shown as light and dark gray, respectively, while the less-conserved ones in the third RRM-like U2AF homology motif (UHM) domain are shown as white and light gray. (F) FBP requires its target nucleic acids for strong FIR interaction. His-tagged FBP N+KH2+3 was incubated with GST (lanes 1 and 2) or GST-FIR RRM1+2 (lanes 3 to 5) in the absence (lanes 1 and 3) or presence (lanes 2 and 4) of the c-myc FUSE 29-mer oligonucleotides. The proportion of His-FBP N+KH2+3 pulled down with GST or GST-FIR RRM1+2 was assessed by Western analysis using anti-FBP or anti-FIR antibody. The non-FBP-binding 40-mer from the complementary FUSE sequence was used as a specificity control (lane 5).
FIG. 2.
FIG. 2.
An alanine-rich patch on the FBP N-terminal α-helix allows FIR to bind. (A) The N-terminal α-helices of the three FBP homologues license or prohibit their interaction with FIR. Each full-length FBP, from the αN to the last amino acid residue, was fused to the GAL4 DBD and tested for FIR interaction using yeast two-hybrid assays (top). The three different N-terminal α-helices (αN from FBP, αN2 from FBP2, and αN3 from FBP3) fused directly to the same FBP/FBP1 CD were compared for FIR binding (middle). The three different central domains (CD from FBP, CD2 from FBP2, and CD3 from FBP3), each fused to the same FBP/FBP1 αN, were also compared (bottom). α-Helical regions in the N-terminal domain and the central domain are indicated in gray boxes for FBP, dotted boxes for FBP2, and hatched boxes for FBP3. (B) FBP3 has the most divergent N-terminal α-helix. Amino acid sequences are shown for the three αN regions. Numbering is based on the FBP/FBP1 sequence, and the amino acid residues deviating in only one FBP family member are marked in gray boxes. Residues that are the same for all three FBPs are marked with asterisks. (C, top) A hydrophobic patch on the FBP αN composed of Phe-31, Leu-35, and Ala-38 is critical for FIR binding. The GAL4 DBD-FBP derivative shown on the top served as the template for PCR mutagenesis directed at the N-terminal α-helix (αN). Strains with single and double mutations attenuating or eliminating FIR binding were compared with the wild type using yeast two-hybrid and quantitative β-Gal assays. (Bottom) Similar levels of expression of the wild type and the FIR-binding-defective mutant FBPs were verified by immunoblot analysis of the same yeast transformants used for interaction assays. FIR proteins from the cotransformed pGAD-FIR plasmid were used as an internal control. G4, GAL4. (D) Ala-34 also participates in forming the FIR-binding patch on the FBP N-terminal α-helix. Additional Ala residue neighbors of Ala-38 in the predicted three-dimensional α-helix structure (shown in Fig. 2F) were mutated to Val and compared with the wild type and A38V mutant as well as with the helix-breaking Pro substitutions on the hydrophilic surface. In order to test the direct contribution of the alanine methyl group in FIR binding, Ala-38 was also replaced by a smaller residue, Gly. One of the two helix-breaking, double-Pro substitutions failed to express any stably detectable GAL4 DBD fusion protein (R39P Q40P). (E) The same FBP αN mutants faulty for FIR binding in yeast two-hybrid assays failed to bind FIR in vitro. Three purified double mutants as well as wild-type His-FBP N+KH2+3 were incubated with GST-FIR RRM1+2 in the absence (−) or presence (+) of the c-myc FUSE 29-mer, as shown in Fig. 1F. (F) Three-dimensional helical wheel of αNs. The amino acid residues of the three FBP αNs are shown along the hydrophobic face of the helical wheel. Proposed FIR-binding surfaces on αN and αN2 are shown as enclosed boxes. The FBP3 Val that replaces an Ala in FBP1 and FBP2 and disrupts the FBP3-FIR interaction is marked by an arrow. Amino acid numbering is specific for each FBP, and hydrophobic or hydrophilic residues are marked as gray or white, respectively.
FIG. 3.
FIG. 3.
The effector output of the FBPs is graded. (A, top) The C terminus of FBP3 is the strongest transactivator among the FBPs. Each FBP C was expressed as a GAL4 DBD fusion in HeLa cells and tested for transactivation of a single GAL4 site-driven firefly luciferase reporter using 0, 100, and 250 ng. The total amount of DNA used per transfection was kept constant by adjustment with an empty GAL4 DBD plasmid, and each point was averaged from duplicate transfections. (Bottom) The expression of each GAL4 DBD fusion protein was monitored using anti-GAL4 (G4) DBD antibody and normalized against the actin signal. Each fusion protein of the expected size is marked with an arrow. (B) Only the FBP3 N terminus is devoid of the repressor activity. Each FBP N was expressed as a LexA fusion, and all were tested for their effect on transactivation by GAL4-FBP C. Arrows mark the luciferase activity levels before and after transactivation by FBP C, demonstrating that the basal transcription (the height of gray bars) is resistant to repression by FBP N. (Bottom) The expression of each LexA fusion protein was monitored using anti-LexA antibody, and GAL4 DBD-FBP C expression from the cotransfected plasmid is shown as an internal control. (C) FBP3 does not interact with FIR in vivo. Extracts of the DSP-cross-linked HeLa cells were immunoprecipitated with anti-FIR and analyzed for the presence of coprecipitated FBPs. FBP2 was monitored through cross-reactivity with anti-FBP/FBP1. IgG, immunoglobulin G; α-FIR, anti-FIR. (D) FBP3 is the strongest c-myc transactivator. Plasmids encoding each HA-tagged full-length FBP were transfected (0, 50, 100, 250, and 500 ng for each) into HeLa cells and compared for their effects on the c-myc promoter luciferase reporter. (Bottom) The expression of each HA-FBP was monitored using anti-HA tag antibody. Lane 1 shows 0 ng of HA-FBP-expressing plasmid transfection, and lanes 2 to 5 show each HA-FBP-expressing plasmid in 50- to 500-ng transfections. (E) Recruitment of FBP3 precedes FBP/FBP1 at the c-myc promoter upon serum stimulation. Serum-starved human fibroblast cells (Hs68) were formaldehyde cross-linked at the indicated time points after serum induction and analyzed for FBP or FBP3 binding to FUSE using chromatin IP. (Bottom) Location of the primer pair is shown relative to the c-myc P2 promoter.
FIG. 4.
FIG. 4.
Subcellular distributions and intranuclear trafficking of the FBPs. (A) FBP3 lacks half of the bipartite NLS present in FBP and FBP2. Amino acid sequences around the conserved NLS (gray boxes) are compared for the three FBPs. Numbering is based on the FBP/FBP1 sequence, and the residues that are the same for all three FBPs are marked with asterisks. (B) Only FBP3 localizes both inside and outside the nucleus. The three full-length FBPs were expressed as GFP, CFP, or YFP fusions in HeLa cells and observed by confocal microscopy. Representative images are shown for CFP-FBP, CFP-FBP2, and YFP-FBP3. (C) All three FBPs colocalize in the nucleoplasm. Images are of CFP-FBP and YFP-FBP3 expressed in HeLa cells, and the fluorescence intensity of each GFP derivative along the area of the red arrow in the merged image is plotted on the bottom. (D) FBP3 has FRAP kinetics slower than those of the other FBPs. Each GFP-FBP was expressed in HeLa cells, photobleached, and measured for its fluorescence recovery every 0.5 s (left). (Right) The expression of each GFP or its variant fusion protein was monitored by Western analysis using anti-GFP and antiactin antibodies.
FIG. 5.
FIG. 5.
The FBPs cross-regulate many common targets. (A) Knockdown of each FBP by siRNA transfection. HeLa whole-cell extracts were compared by Western analysis 2 days posttransfection with the indicated siRNAs. Endogenous FBP2 levels were monitored using a cross-reacting anti-FBP/FBP1 primary antibody. (B) Hierarchical cluster analysis of the FBP knockdown microarrays. Each microarray was hybridized with two differentially labeled cDNAs derived from the total human primary fibroblast RNAs, one from the indicated siFBP transfection and the other from the negative-control siRNA transfection. Each column represents an independent experiment, and each row represents an individual gene/feature. Boxes with red or green color indicate the extent of up- or down-regulation as shown in the scale bar at the bottom. One hundred seventy-two selected genes that consistently responded to siFBP transfections are shown on the left, and two representative groups that behaved similarly in all six arrays (either up or down) are shown enlarged with their gene descriptions on the right. The complete list of 172 genes is available in Table S1 in the supplemental material, and the entire microarray data set has been deposited in the GEO database under the accession number GSE4914. MHC, major histocompatibility complex; ADAM, a disintegrin and metalloprotease; RGM, repulsive guidance molecule. (C) A Venn diagram summary of the siFBP microarray. Numbers of up- or down-regulated genes that responded commonly or uniquely in response to the knockdown of each FBP are shown in red and green, respectively.

References

    1. Avigan, M. I., B. Strober, and D. Levens. 1990. A far upstream element stimulates c-myc expression in undifferentiated leukemia cells. J. Biol. Chem. 265:18538-18545. - PubMed
    1. Bazar, L., V. Harris, I. Sunitha, D. Hartmann, and M. Avigan. 1995. A transactivator of c-myc is coordinately regulated with the proto-oncogene during cellular growth. Oncogene 10:2229-2238. - PubMed
    1. Braddock, D. T., J. L. Baber, D. Levens, and G. M. Clore. 2002. Molecular basis of sequence-specific single-stranded DNA recognition by KH domains: solution structure of a complex between hnRNP KKH3 and single-stranded DNA. EMBO J. 21:3476-3485. - PMC - PubMed
    1. Braddock, D. T., J. M. Louis, J. L. Baber, D. Levens, and G. M. Clore. 2002. Structure and dynamics of KH domains from FBP bound to single-stranded DNA. Nature 415:1051-1056. - PubMed
    1. Briata, P., S. V. Forcales, M. Ponassi, G. Corte, C. Y. Chen, M. Karin, P. L. Puri, and R. Gherzi. 2005. p38-dependent phosphorylation of the mRNA decay-promoting factor KSRP controls the stability of select myogenic transcripts. Mol. Cell 20:891-903. - PubMed

Publication types

MeSH terms