. 2006 Sep;116(9):2521-31.
doi: 10.1172/JCI28057. Epub 2006 Aug 17.

PTEN inhibits IL-2 receptor-mediated expansion of CD4+ CD25+ Tregs

Affiliations

PTEN inhibits IL-2 receptor-mediated expansion of CD4+ CD25+ Tregs

Patrick T Walsh et al. J Clin Invest. 2006 Sep.

Abstract

One of the greatest barriers against harnessing the potential of CD4+ CD25+ Tregs as a cellular immunotherapy is their hypoproliferative phenotype. We have previously shown that the hypoproliferative response of Tregs to IL-2 is associated with defective downstream PI3K signaling. Here, we demonstrate that targeted deletion of the lipid phosphatase PTEN (phosphatase and tensin homolog deleted on chromosome 10) regulates the peripheral homeostasis of Tregs in vivo and allows their expansion ex vivo in response to IL-2 alone. PTEN deficiency does not adversely affect either the thymic development or the function of Tregs, which retain their ability to suppress responder T cells in vitro and prevent colitis in vivo. Conversely, reexpression of PTEN in PTEN-deficient Tregs as well as in activated CD4+ T cells inhibits IL-2-dependent proliferation, confirming PTEN as a negative regulator of IL-2 receptor signaling. These data demonstrate that PTEN regulates the "anergic" response of Tregs to IL-2 in vitro and Treg homeostasis in vivo and indicate that inhibition of PTEN activity may facilitate the expansion of these cells for potential use in cellular immunotherapy.


Figures

Figure 1
Figure 1. Thymic development of CD4+ Foxp3+ Tregs in the absence of PTEN.
(A) PTEN is expressed at equivalent levels in CD4+CD25 and CD4+CD25+ T cell subsets from normal mice. (B) Specific recombination at the Pten locus in the presence of Cre was shown by PCR amplification of an 849-bp product in genomic DNA isolated from CD4+ T cells from Cre-ve (+/+), Ptenflox/+Cre+ (+/–), and Ptenflox/floxCre+ (–/–) littermates. (C) Expression of PTEN protein in CD4+ T cells isolated as above. β-Actin was used as a loading control. (D) CD4+CD8+ double-positive (DP), CD4+ single-positive (SP), and peripheral CD4+ T cells were isolated by FACS from 3-week-old wild-type and PTEN-ΔT mice. Cells were subsequently lysed and analyzed for expression of PTEN by immunoblotting. (E) T cell–depleted bone marrow cells from wild-type (Thy1.1+) and PTEN-ΔT (Thy1.2+) mice were used to reconstitute lethally irradiated Thy1.1+ hosts. Mice were reconstituted with either 100% wild-type, 100% PTEN-ΔT, or a mixture of 50% each. Thymic regulatory subsets (CD4SP Foxp3+) were analyzed 10 weeks after reconstitution. Data shown are representative of results from 3 chimeric mice per condition.
Figure 2
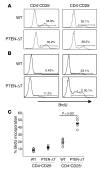
Figure 2. Isolation and analysis of CD4+ CD25+ CD45RBlo Tregs from PTEN-ΔT mice.
(A) Expression of the T cell–activation marker CD69 on CD4+ T cells from PTEN-ΔT mice and wild-type littermates at age 2 weeks, before the onset of disease, and at age 8 weeks. (B) Frequency of CD4+ T cells that are CD25hiCD45RBlo from 2-week-old PTEN-ΔT and wild-type littermate mice. (C) Real-time PCR analysis of Foxp3 expression on FACS-purified CD4+CD25CD45RBhi and CD4+CD25+CD45RBlo cells from 2-week-old PTEN-ΔT and wild-type littermate mice. (D) Purified CD4+CD25CD45RBhi cells (1 × 10⁵) from littermate control mice were stimulated with anti-CD3 (0.5 μg/ml) plus irradiated APCs (3 × 10⁶) for 72 hours in the presence of the indicated ratios of CD4+CD25+CD45RBlo Tregs purified from either PTEN-ΔT mice or wild-type mice. Tritiated thymidine was added to cultures for the final 16 hours before harvesting. All data are representative of at least 2 independent experiments. Data shown represent mean ± SD of triplicate samples.
Figure 3
Figure 3. Proliferation of PTEN-ΔT CD4+ CD25+ CD45RBlo Tregs in response to IL-2R stimulation.
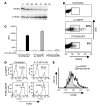
(A) Purified CD4+CD25+CD45RBlo and CD4+CD25+CD45RBhi cells from both wild-type and PTEN-ΔT mice were cultured at a constant density of 1 × 10⁵/well in the presence of rIL-2 (100 U/ml) for a 2-week period. At the indicated time points, total cell numbers were quantitated by trypan blue exclusion. Only PTEN-ΔT CD4+CD25+CD45RBlo cells exhibited a significant increase in cell number with all other cell types showing overlapping live cell numbers over the examination period. Data are representative of 5 different experiments. (B) Purified CD4+CD25+CD45RBlo cells from wild-type, PTEN-het (HET), and PTEN-ΔT mice were cultured in the presence of rIL-2 (100 U/ml) for 48 hours. Tritiated thymidine was added to cultures for the final 16 hours before harvesting. (C) PTEN-ΔT CD4+CD25+CD45RBlo cells were CFSE labeled and cultured in the presence of rIL-2 (100 U/ml) for 10 days. CFSE dilution was analyzed at the indicated time points by FACS analysis. Results are representative of 4 separate experiments. FSC, forward scatter. (D) Purified wild-type and PTEN-ΔT CD4+CD25+CD45RBlo cells and preactivated CD4+ T cell blasts were stimulated with titrated doses of rIL-2 as shown for 72 hours. Tritiated thymidine was added to cultures for the final 16 hours before harvesting. (E) CD4+ T cells were isolated from ER-Cre+/Ptenflox/flox mice and lysed immediately or after culture in the presence of rIL-2 (100 U/ml) and 4-OHT (1 nM). Samples were electrophoresed on an SDS-PAGE gel, transferred to nitrocellulose membranes, and probed as indicated. Purified CD4+ T cells from a littermate control mouse were used as a positive control (+ve ctrl) for PTEN expression. (F) Purified ER-Cre+/Ptenflox/flox CD4+CD25+ Tregs were CFSE labeled and cultured in the presence of rIL-2 (100 U/ml) and 4-OHT (1 nM) for 7 days. CFSE dilution was analyzed by FACS. Results are representative of 3 independent experiments. Data shown represent mean ± SD of triplicate samples.
Figure 4
Figure 4. Reexpression of PTEN in PTEN-ΔT Tregs restores hypoproliferative response to IL-2.
Purified PTEN-ΔT CD4+CD25+CD45RBlo cells were CFSE labeled and retrovirally transduced as described in Methods, with either MIGR1-NGFR empty vector (ev-NGFR) or PTEN-containing virus (PTEN-NGFR). Cells were analyzed for expression of human NGFR 96 hours after infection and CFSE dilution of NGFR-positive cells analyzed by flow cytometry. Results are representative of 3 independent experiments. SSC, side scatter.
Figure 5
Figure 5. PTEN-ΔT CD4+ CD25+ CD45RBlo cells remain hypoproliferative to TCR stimulation.
(A) Purified PTEN-ΔT or wild-type CD4+CD25+CD45RBlo cells were CFSE labeled and stimulated with plate-bound anti-CD3 (5 μg/ml) for 72 hours. (B) Supernatants were harvested under the conditions described above after 24 hours stimulation, and levels of IL-2 were determined by ELISA. Data shown represent the mean ± SD of triplicate samples. Data are representative of 3 separate experiments. (C) Purified PTEN-ΔT or wild-type CD4+CD25+CD45RBlo cells were stimulated with IL-2 (100 U/ml), irradiated APCs, and varying doses of anti-CD3 (2C11) as shown for 72 hours. Tritiated thymidine was added to cultures for the final 16 hours before harvesting. Data shown represent the mean ± SD of triplicate samples. WT25+, CD4+CD25+CD45RBlo cells from wild-type mice; ΔT25+, CD4+CD25+CD45RBlo cells from PTEN-ΔT mice; WT25, CD4+CD25CD45RBhi cells from wild-type mice; ΔT25, CD4+CD25CD45RBhi cells from PTEN-ΔT mice.
Figure 6
Figure 6. PTEN-ΔT Tregs exhibit enhanced homeostatic expansion in the periphery.
PTEN-ΔT mice and littermate controls were administered 1 mg BrdU every 12 hours for 3 days, at which time they were sacrificed and thymus and spleen cells were stained for BrdU. (A) Levels of BrdU incorporation in CD4+CD8CD25+ and CD4+CD8CD25 thymocytes. (B) Levels of BrdU incorporation in CD4+CD25+ and CD4+CD25 splenocytes. (C) Percentage BrdU-positive CD4+CD25+ and CD4+CD25 splenocytes from PTEN-ΔT mice (n = 6) and littermate controls (n = 6).
Figure 7
Figure 7. Deletion of PTEN facilitates IL-2R signaling downstream of PI3K in Tregs.
FACS-purified CD4+CD25+CD45RBlo cells from PTEN-ΔT mice were expanded in the presence of rIL-2 (100 U/ml) for 8 days. Cells were washed extensively and, along with freshly isolated wild-type Tregs, were rested overnight in complete medium. Cells were subsequently left unstimulated (uns) or stimulated with 100 U/ml rIL-2 for 30 minutes. Samples were lysed and electrophoresed on an SDS-PAGE gel, transferred to nitrocellulose membranes, and probed as indicated. p, phosphorylated.
Figure 8
Figure 8. Reexpression of PTEN in activated CD4+ T cells inhibits IL-2–mediated proliferation.
(A) Splenocytes from DO11.10 TCR transgenic mice were stimulated with ova peptide (1 μg/ml). CD4+ T cells were purified by magnetic bead separation at the indicated time points and subsequently lysed. Samples were analyzed for PTEN expression by Western blot, and membranes were stripped and reprobed for β-actin as a loading control. Results are representative of 3 independent experiments. (B) Purified CD4+ T cells were retrovirally transduced, as described in Methods, with either MIGR1-NGFR empty vector or PTEN-containing virus. Cells were analyzed for expression of human NGFR 48 hours after infection. Data shown illustrate typical transduction efficiencies achieved using these vectors. The gate drawn shows NGFR-positive subsets used for comparison in subsequent experiments. (C) NGFR-positive cells were purified either by FACS sort or magnetic bead separation and cultured in the presence or absence of rIL-2 (20 U/ml) for 48 hours. Tritiated thymidine was added to cultures for the last 16 hours before harvesting. Data shown represent the mean ± SD of triplicate cultures and are representative of 4 independent experiments. (D) Cells as in C were analyzed for viability by 7-AAD incorporation. Data shown is representative of 4 independent experiments. (E) Purified CD4+ T cells were CFSE labeled before stimulation and retroviral transduction. After infection, cells were cultured in the presence of rIL-2 (10 U/ml) for 48 hours, and cells expressing identical levels of NGFR were analyzed for CFSE dilution by flow cytometry.
Figure 9
Figure 9. Ex vivo expansion of PTEN-ΔT Tregs does not affect their regulatory phenotype.
(A) Real-time PCR analysis of expression levels of Foxp3 mRNA in PTEN-ΔT CD4+CD25+CD45RBlo cells that have been expanded for 8 days ex vivo with rIL-2 compared with freshly isolated CD4+CD25+CD45RBlo and CD4+CD25CD45RBhi cells from wild-type littermate mice. Results are representative of 3 independent experiments. LMC, littermate control. (B) Expression of Foxp3 protein on CFSE-labeled PTEN-ΔT CD4+CD25+CD45RBlo cells expanded for 8 days with rIL-2 (100 U/ml). (C) PTEN-ΔT Tregs were expanded in the presence of rIL-2 for 8 days and subsequently washed extensively before coculture at the indicated ratio with wild-type CD4+CD25CD45RBhi responder cells expressing the Thy1.1 congenic marker. Freshly isolated CD4+CD25+CDRBlo cells from wild-type mice were used for direct comparison. Cells were stimulated in the presence of 3 × 10⁵ irradiated APCs with soluble anti-CD3 (0.5 μg/ml) for 72 hours, at which time CFSE dilution of Thy1.1-expressing responder cells was examined by flow cytometry. 25+:25, ratio of CD4+CD25+CD45RBlo cells to CD4+CD25CD45RBhi cells as denoted in the labels to the left of the panels. (D) Quantitative comparison of level of suppression by wild-type and PTEN-ΔT Tregs through calculation of number of mitotic events of Thy1.1+ responder cells.
Figure 10
Figure 10. Prevention of colitis by ex vivo expanded PTEN-ΔT Tregs.
Rag1–/– mice were injected with 6 × 10⁶ freshly isolated wild-type CD4+CD25CD45RBhi cells either alone (n = 5) or together with 3 × 10⁶ freshly isolated wild-type Tregs (n = 5) or PTEN-ΔT Tregs that had been expanded for 5 days ex vivo with rIL-2 (n = 7). (A) Body weight is represented as percentage of initial weight 8 weeks after transfer. Statistical analysis was performed using an unpaired 2-tailed Student’s t test. (B) Severity of colitis was histologically scored as described previously (25).

References

    1. Sakaguchi S. Naturally arising CD4+ regulatory t cells for immunologic self-tolerance and negative control of immune responses. Annu. Rev. Immunol. 2004;22:531–562. - PubMed
    1. Mottet C., Uhlig H.H., Powrie F. Cutting edge: cure of colitis by CD4+CD25+ regulatory T cells. J. Immunol. 2003;170:3939–3943. - PubMed
    1. Taylor P.A., Lees C.J., Blazar B.R. The infusion of ex vivo activated and expanded CD4(+)CD25(+) immune regulatory cells inhibits graft-versus-host disease lethality. Blood. 2002;99:3493–3499. - PubMed
    1. Walsh P.T., Taylor D.K., Turka L.A. Tregs and transplantation tolerance. J. Clin. Invest. 2004;114:1398–1403. doi: 10.1172/JCI200423238. - DOI - PMC - PubMed
    1. Takahashi T., et al. Immunologic self-tolerance maintained by CD25+CD4+ naturally anergic and suppressive T cells: induction of autoimmune disease by breaking their anergic/suppressive state. Int. Immunol. 1998;10:1969–1980. - PubMed

Publication types

MeSH terms