Review
. 2006 Sep;6(3):311-25.
doi: 10.2174/187152606778249935.

Mass spectrometry-based proteomics and its application to studies of Porphyromonas gingivalis invasion and pathogenicity

Affiliations
Review

Mass spectrometry-based proteomics and its application to studies of Porphyromonas gingivalis invasion and pathogenicity

Richard J Lamont et al. Infect Disord Drug Targets. 2006 Sep.

Abstract

Porphyromonas gingivalis is a Gram-negative anaerobe that populates the subgingival crevice of the mouth. It is known to undergo a transition from its commensal status in healthy individuals to a highly invasive intracellular pathogen in human patients suffering from periodontal disease, where it is often the dominant species of pathogenic bacteria. The application of mass spectrometry-based proteomics to the study of P. gingivalis interactions with model host cell systems, invasion and pathogenicity is reviewed. These studies have evolved from qualitative identifications of small numbers of secreted proteins, using traditional gel-based methods, to quantitative whole cell proteomic studies using multiple dimension capillary HPLC coupled with linear ion trap mass spectrometry. It has become possible to generate a differential readout of protein expression change over the entire P. gingivalis proteome, in a manner analogous to whole genome mRNA arrays. Different strategies have been employed for generating protein level expression ratios from mass spectrometry data, including stable isotope metabolic labeling and most recently, spectral counting methods. A global view of changes in protein modification status remains elusive due to the limitations of existing computational tools for database searching and data mining. Such a view would be desirable for purposes of making global assessments of changes in gene regulation in response to host interactions during the course of adhesion, invasion and internalization. With a complete data matrix consisting of changes in transcription, protein abundance and protein modification during the course of invasion, the search for new protein drug targets would benefit from a more comprehensive understanding of these processes than what could be achieved prior to the advent of systems biology.


Figures
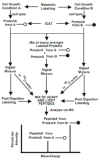
Figure 1
Figure 1
The different approaches to differentially labeling proteins with stable isotopes are reviewed in [25], and shown here. The preferred approach used for studies of P. gingivalis invasion is metabolic labeling. Copyright American Chemical Society, Anal Chem. 2002, 74, 1650–1657.
Figure 2
Figure 2
Processing of P. gingivalis whole cell protein extracts to yield tryptic fragments prior to analysis using 2D capillary HPLC and tandem mass spectrometry (MudPIT).
Figure 3
Figure 3
Diagram showing the original MudPIT method [23], consisting of a single capillary packed with a strong cation exchange resin (SCX) and and a reversed phase packing (RP). We have adapted this technology to our studies of P. gingivalis and other prokaryotes. Reprinted by permission from Macmillan Publishers Ltd., Nat. Biotechnol. 2001, 19, 242–247.
Figure 4
Figure 4
Flow chart describing the order of events when SEQUEST [38, 39] was used in our laboratory to search the P. gingivalis ORF database directly, through 2003. Prior to the ORF search the CID data were normally searched against a large protein database (e.g. Swiss-Prot or nrdb) to identify any non-P. gingivalis proteins that were present. More recently, d2g and add_intensity have been replaced by scripts written in Filemaker Pro.
Figure 5
Figure 5
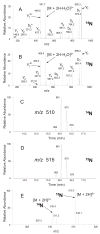
Representative mass spectral data used to identify proteins and calculate expression ratios. Here we illustrate the logic flow used by our quantitation software with a single ratio calculation. Details for the chromatographic, data-dependent mass spectral data acquisition and database searching parameters are given in the original paper cited below. Briefly, after separation of peptides by liquid chromatography, two kinds of mass spectral scans were obtained. The primary (MS1) scans contained intact parent ions from peptide mixtures. The collision-induced dissociation (CID, MS2) scans contained fragmentation ions derived from individual parent ions of the MS1 scans. In addition, single ion chromatograms were generated which plot the intensity of a single MS1 ion vs. time. In the data analysis, peptide sequences belonging to predicted ORFs were identified in both “heavy” 15N and “light” 14N forms. In this example, the identified peptide was KPIEEYLK, a peptide derived from the methanogen M. maripaludis. A, CID spectrum (MS2 scan # 664) from the doubly charged parent ion 510.4 identifying it as 14N KPIEEYLK. B, CID spectrum (MS2 scan #660) from the doubly charged parent ion 515.3 identifying it as 15N KPIEEYLK. The nomenclature used to designate key peptide sequence ions is that of Biemann [85]. Ions labeled y and b indicate sequence-specific ions containing carboxy and amino termini, respectively, and * indicates a loss of water or ammonia. The CID spectra (MS2) were used to generate a table of identified peptides. Each MS2 spectrum was linked by the data system with a specific MS1 ion, i.e. parent ion. Next, single ion chromatograms were checked for each parent ion to determine which MS1 scan contained the maximum signal intensity. C and D, single ion chromatograms of MS1 m/z 510.4+/−0.5 and MS1 m/z 515.3+/−0.5 respectively, showing that both intensities were maximum at scan # 661 (numbers by peaks indicate scan number). Having identified the MS1 scan with the maximum observed intensities of the parent ions, this scan was measured for the intensities of the signals at m/z 510.4 and 515.3. E, MS1 scan # 661 in bar graph format, showing the two signals used in the ratio calculation. The intensities were 5.14 × 10⁷ counts and 2.40 × 10⁷ counts respectively, yielding a “heavy”: “light” ratio of 2.14. In total there were 76 ratios calculated (n1) from heavy-light signal pairs that were acquired from eight unique peptide sequences for this ORF, yielding an average ratio of 2.68. If the average ratio from all measurements +/− the standard deviation did not overlap with a ratio of 1.0, the ratio was judged to indicate a significant difference in expression at the protein level. Reprinted from [16], Molecular and Cellular Proteomics, 2006, 5, 868–881, with permission of the ASBMB.
Figure 6
Figure 6
Reconstructed semi-quantitation map of the P. gingivalis proteome. Each spot represents an ORF in the Pg database. ORFs are ordered according to their TIGR numbers. KEY: ORFs that were uniquely identified in cKGM (red spots), ORFs that were uniquely identified in KGM (green spots). The red and green spots with thick black circles represent the ORFs that were semi-quantitatively identified; ORFs that were identified in both cKGM and KGM (yellow spots). The yellow spots with thick black circle represent the ORFs that were semi-quantitatively identified in both samples and show no significant difference. The yellow spots with thick red or green circles represent the ORFs that have been semi-quantitatively identified in both samples and are up-regulated in cKGM or KGM respectively. The yellow spots with a thick red or green circle and thin black circle represent the ORFs that were semi-quantitatively identified only in cKGM or KGM respectively. This representation of the proteome, while rich in information, was subsequently abandoned due to its excessive visual complexity.
Figure 7
Figure 7
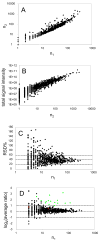
Scatter plots illustrating relationships among total signal intensity, the number of heavy/light isotopic peptide pairs recovered per ORF (n1), the number of redundant peptides recovered per ORF (n2), and the relative standard deviations for the protein level expression ratios calculated for each ORF in a typical whole proteome analysis for a prokaryote. A, correlation of the number of redundant peptides (n2) observed for each protein with the number of peptide pairs (n1) for the same protein. Observations from 939 proteins were used to generate the plot. B, correlation of total signal intensity observed for all peptide “hits” associated with a given ORF and the number of observed redundant peptides (n2). C, relative standard deviation (RSD) of the mean expression ratio for 688 proteins (n1≥3). The average RSD was 44%, which is driven largely by the data points in the upper left. Many of the data points with larger RSD values share a common characteristic, a non-detect in either the numerator or the denominator, e.g. instances in which a strong signal was observed for one condition but only baseline noise or a weak signal was observed for the corresponding peptide in the other condition. At high values of n1 the RSD converges to about 35% in this dataset. D, distribution of the 688 average protein expression ratios (n1≥3) as a function of n1. The 15 data points marked in grey are the genes that are considered as up-regulated in a mutant with respect to the wild-type organism, as determined by both cDNA microarrays and proteomics., The 15 genes for which there was a consensus for up-regulation yielded mean protein expression ratios ≥2. Statistically and biologically significant expression changes stand out more clearly as n1 and n2 go to higher values, see text discussion. Taken from [16], Molecular and Cellular Proteomics, 2006, 5, 868–881, with permission of the ASBMB.
Figure 8
Figure 8
Scatterplot matrix of the spectral counts of the common 751 proteins from three replicate MudPIT runs of P. gingivalis proteins internalized within GECs. This plot was generated in S-PLUS 6.0 (www.insightful.com). The x-axis, from left to right, shows the protein level spectral counts from run1, run2 and run3; the y-axis, from top to down, are the protein level spectral counts from run1, run2 and run3. Each panel thus contains the scatter plot of the corresponding x- and y-axes. 751 P. gingivalis proteins were always identified in all of the three runs, out of a total of ~900. Protein level spectral counts [–32] were calculated for each protein in each run by summing the number of redundant CID spectra associated with that protein and that passed the DTASelect [43] filtering criteria. The DTASelect filter criteria we used were: 1.9 for XCorr for singly charged peptide ions; 2.0 for doubly charged; 3.3 for triply charged and fully tryptic peptides. Pearson correlation coefficients were calculated between every two sets of data and noted in each scatterplot panel. As shown in the scatterplots, all three runs showed a high Pearson correlation coefficient with each other. Both the protein identifications and the spectral counts for quantitation were highly reproducible in these datasets (Xia and coworkers, unpublished data). These data were acquired with an LTQ mass spectrometer.
Figure 9
Figure 9
Scatterplot of log2 of the total spectral counts from replicate analyses (run1, run2) of PG_IHGK (P. gingivalis internalized within GECs) versus log2 of run1/run2 spectral count ratios. The plot shows 987 data points. The ratios are quantized when the spectral count value for both runs goes below a total of about ~3.4 on the log2 scale, which corresponds to a sum of spectral counts from run1 and run2 of approximately 10 peptides. These data were acquired using an LTQ mass spectrometer coupled with a 2D HPLC system as described [16].

Similar articles

Cited by

References

    1. Washburn MP, Yates JR., III Curr Opin Microbiol. 2000;3:292. - PubMed
    1. Brötz-Oesterhelt H, Bandow JE, Labischinski H. Mass Spectrom Rev. 2005;24:549. - PubMed
    1. Pandey A, Mann M. Nature. 2000;405:837. - PubMed
    1. Eichler J, Adams MWW. Microbiol Molec Biol Rev. 2005;69:393. - PMC - PubMed
    1. Coon JJ, Syka JEP, Shabanowitz J, Hunt DF. BioTechniques. 2005;38:519. - PubMed

Publication types

MeSH terms

Substances