. 2006 Nov;88(5):580-90.
doi: 10.1016/j.ygeno.2006.06.015. Epub 2006 Aug 17.

GAA repeat expansion mutation mouse models of Friedreich ataxia exhibit oxidative stress leading to progressive neuronal and cardiac pathology

Affiliations

GAA repeat expansion mutation mouse models of Friedreich ataxia exhibit oxidative stress leading to progressive neuronal and cardiac pathology

Sahar Al-Mahdawi et al. Genomics. 2006 Nov.

Abstract

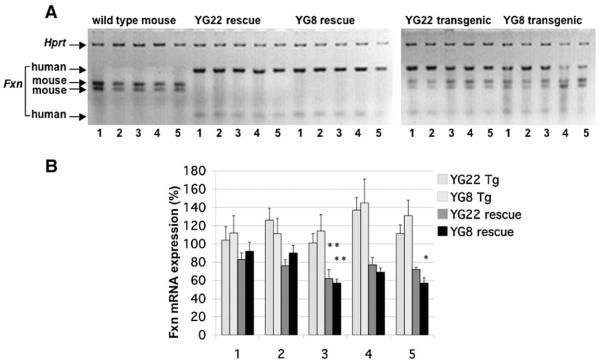
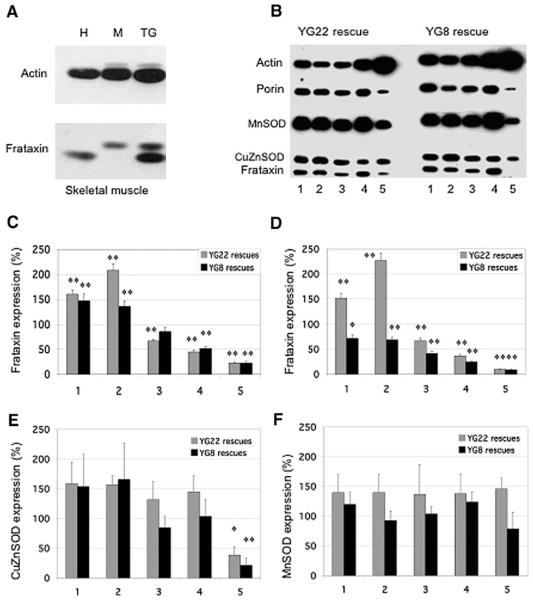
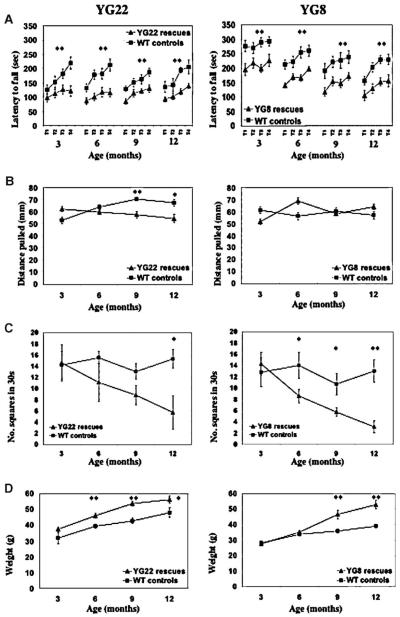
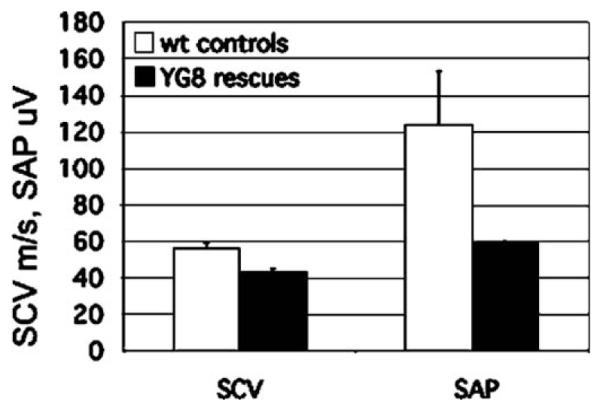
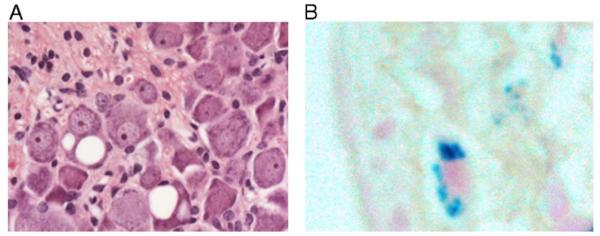
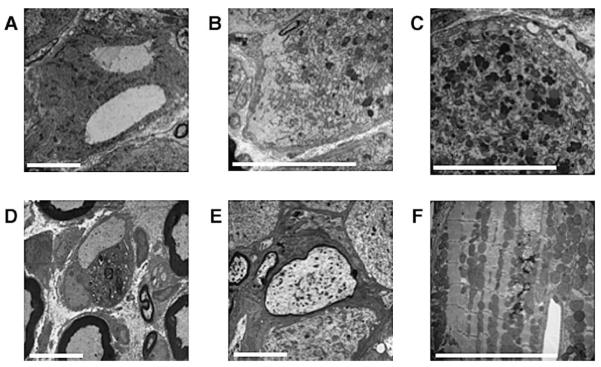
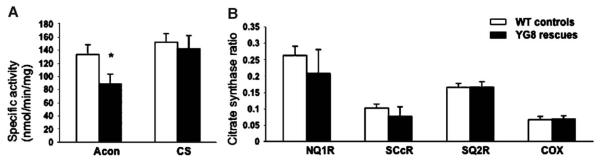
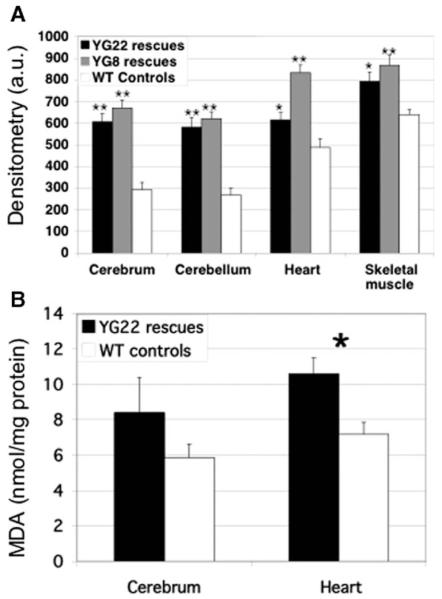
Friedreich ataxia (FRDA) is a neurodegenerative disorder caused by an unstable GAA repeat expansion mutation within intron 1 of the FXN gene. However, the origins of the GAA repeat expansion, its unstable dynamics within different cells and tissues, and its effects on frataxin expression are not yet completely understood. Therefore, we have chosen to generate representative FRDA mouse models by using the human FXN GAA repeat expansion itself as the genetically modified mutation. We have previously reported the establishment of two lines of human FXN YAC transgenic mice that contain unstable GAA repeat expansions within the appropriate genomic context. We now describe the generation of FRDA mouse models by crossbreeding of both lines of human FXN YAC transgenic mice with heterozygous Fxn knockout mice. The resultant FRDA mice that express only human-derived frataxin show comparatively reduced levels of frataxin mRNA and protein expression, decreased aconitase activity, and oxidative stress, leading to progressive neurodegenerative and cardiac pathological phenotypes. Coordination deficits are present, as measured by accelerating rotarod analysis, together with a progressive decrease in locomotor activity and increase in weight. Large vacuoles are detected within neurons of the dorsal root ganglia (DRG), predominantly within the lumbar regions in 6-month-old mice, but spreading to the cervical regions after 1 year of age. Secondary demyelination of large axons is also detected within the lumbar roots of older mice. Lipofuscin deposition is increased in both DRG neurons and cardiomyocytes, and iron deposition is detected in cardiomyocytes after 1 year of age. These mice represent the first GAA repeat expansion-based FRDA mouse models that exhibit progressive FRDA-like pathology and thus will be of use in testing potential therapeutic strategies, particularly GAA repeat-based strategies.


Figures

Fig. 1
Fig. 1
mRNA expression analysis. (A) A representative RT-PCR image showing restriction-digested human frataxin products (112 and 29 bp) and mouse frataxin products (75 and 64 bp), together with mouse Hprt controls. mRNA samples were isolated from tissues of wild-type, YG22 rescue, YG8 rescue, YG22 transgenic, and YG8 transgenic mice (lanes 1, cerebrum; 2, brain stem; 3, cerebellum; 4, heart; 5, skeletal muscle). (B) Levels of frataxin mRNA expression as a percentage value of wild-type mouse expression. Values were generated by determining the means of six different RT-PCR experiments, each normalized to Hprt. Error bars indicate SEM. *p<0.05, **p<0.01.
Fig. 2
Fig. 2
Frataxin and antioxidant enzyme expression levels in YG22 and YG8 rescue mice. (A) Western blot showing comparative levels of frataxin relative to actin in skeletal muscle samples from human (H), wild-type mouse (M), and YG22 transgenic mouse (TG). (B) Western blot of YG22 and YG8 rescue mouse tissue lysates (lanes 1, cerebrum; 2, brain stem; 3, cerebellum; 4, heart; 5, skeletal muscle) hybridized with antibodies against frataxin, actin, porin, MnSOD, and CuZnSOD. The very low levels of YG8 skeletal muscle frataxin, which appear to be negative in this image, were revealed upon longer exposure. (C, D) Levels of transgenic human frataxin expression as a percentage value of endogenous wild-type mouse frataxin expression, (C) relative to porin controls or (D) relative to actin controls (n=5–8). Tissues 1–5 are as described for (B). (E) Levels of CuZnSOD in rescue mice as a percentage value of wild-type mouse expression, normalized to actin (n=3–7). Tissues 1–5 are as described for (B). (F) Levels of MnSOD in rescue mice as a percentage value of wild-type mouse expression, normalized to porin (n=3–6). Tissues 1–5 are as described for (B). Error bars indicate SEM. *p<0.05, **p<0.01.
Fig. 3
Fig. 3
Functional studies of 3-, 6-, 9-, and 12-month-old YG22 and YG8 rescue mice, compared with wild-type controls. (A) Rotarod analysis of YG22 and YG8 rescue mice compared with wild-type littermate controls shows a coordination deficit in both rescue mice from 3 months of age (n=10 and 9, respectively). However, a direct comparison between YG22 and YG8 experiments is not possible due to the use of different rotarod acceleration rate settings carried out at different periods of time. (B) Grip strength analysis shows a weakness in YG22 rescues only from 9 months of age (n=6–10). (C) Locomotor analysis identifies a progressive decrease in the mobility of both rescue mice (n=6–8 and 7–13, respectively). (D) Weight increases are detected in both rescue mice (n=6–16). Error bars indicate SEM. *p<0.05, **p<0.01.
Fig. 4
Fig. 4
Sensory nerve conduction studies of 20-month-old YG8 rescue mice and wild-type controls showing a decrease in sensory conduction velocity (SCV) and sensory action potential (SAP), although not to significance (n=2).
Fig. 5
Fig. 5
Neuronal and cardiac histopathology. (A) H&E-stained section of lumbar DRG from a representative YG22 rescue mouse over 1 year of age, showing two neurons containing large vacuoles. Original magnification 400×. (B) Perl’s staining of a heart section from a representative YG22 rescue mouse over 1 year of age, showing characteristic blue staining indicating iron deposition. Original magnification 600×.
Fig. 6
Fig. 6
(A–E) Electron micrographs of lumbar DRG from 20-month-old YG8 rescue mice showing examples of: (A) giant vacuoles, (B) chromatolysis, and (C) lipofuscin deposits within the large neuronal cell bodies. Also detected within the lumbar DRG are instances of: (D) complete demyelination of a large axon with its associated Schwann cell and (E) large axonal swelling with reduced myelination. (F) Electron micrograph of cardiac muscle from a 20-month-old YG8 rescue mouse showing lipofuscin deposition and lysosomes disrupting an ordered array of mitochondria. Scale bars represent 10 μm.
Fig. 7
Fig. 7
Mitochondrial respiratory chain and aconitase activities in heart tissue from 6-month-old YG8 rescue mutant and control mice. (A) The specific activities of aconitase (Acon) and citrate synthase (CS). CS activities were divided by 10 (n=6). (B) The mitochondrial respiratory chain (MRC) activities expressed as a ratio with citrate synthase; MRC I, NADH coenzyme Q1 reductase (NQ1R); MRC II/III, succinate cytochrome c reductase (SCcR); MRC II, succinate coenzyme Q2 reductase (SQ2R); and MRC IV, cytochrome oxidase (COX). COX/CS ratio was multiplied by a factor of 10 (n=4). Activities are expressed as means ± SEM. *p=0.03.
Fig. 8
Fig. 8
Oxidative stress. (A) Oxyblot analysis detects protein oxidation in cerebrum, cerebellum, heart, and skeletal muscle tissues of 6- to 9-month old YG22 and YG8 rescue mice, compared with wild-type controls, measured in arbitrary units (a.u.) of densitometry (n =8–12). Error bars indicate SEM. *p < 0.05, **p < 0.01. (B) TBARS analysis shows levels of MDA (nmol/mg of protein) as a marker of lipoperoxidation in YG22 cerebrum and heart tissue compared with wild-type controls (n=6). Error bars indicate SEM. *p<0.05.

References

    1. Campuzano V, Montermini L, Molto MD, Pianese L, Cossee M, Cavalcanti F, Monros E, Rodius F, Duclos F, Monticelli A, Zara F, Canizares J, Koutnikova H, Bidichandani SI, Gellera C, Brice A, Trouillas P, De Michele G, Filla A, De Frutos R, Palau F, Patel PI, Di Donato S, Mandel JL, Cocozza S, Koenig M, Pandolfo M. Friedreich’s ataxia: autosomal recessive disease caused by an intronic GAA triplet repeat expansion. Science. 1996;271:1423–1427. - PubMed
    1. Pandolfo M. The molecular basis of Friedreich ataxia. Adv. Exp. Med. Biol. 2002;516:99–118. - PubMed
    1. Campuzano V, Montermini L, Lutz Y, Cova L, Hindelang C, Jiralerspong S, Trottier Y, Kish SJ, Faucheux B, Trouillas P, Authier FJ, Durr A, Mandel JL, Vescovi A, Pandolfo M, Koenig M. Frataxin is reduced in Friedreich ataxia patients and is associated with mitochondrial membranes. Hum. Mol. Genet. 1997;6:1771–1780. - PubMed
    1. Gonzalez-Cabo P, Vazquez-Manrique RP, Garcia-Gimeno MA, Sanz P, Palau F. Frataxin interacts functionally with mitochondrial electron transport chain proteins. Hum. Mol. Genet. 2005;14:2091–2098. - PubMed
    1. Bulteau AL, O’Neill HA, Kennedy MC, Ikeda-Saito M, Isaya G, Szweda LI. Frataxin acts as an iron chaperone protein to modulate mitochondrial aconitase activity. Science. 2004;305:242–245. - PubMed

Publication types

MeSH terms