Review
. 2006 Jun;79(3):136-71.
doi: 10.1016/j.pneurobio.2006.07.001.

Optical and pharmacological tools to investigate the role of mitochondria during oxidative stress and neurodegeneration

Affiliations
Review

Optical and pharmacological tools to investigate the role of mitochondria during oxidative stress and neurodegeneration

Kelley A Foster et al. Prog Neurobiol. 2006 Jun.

Abstract

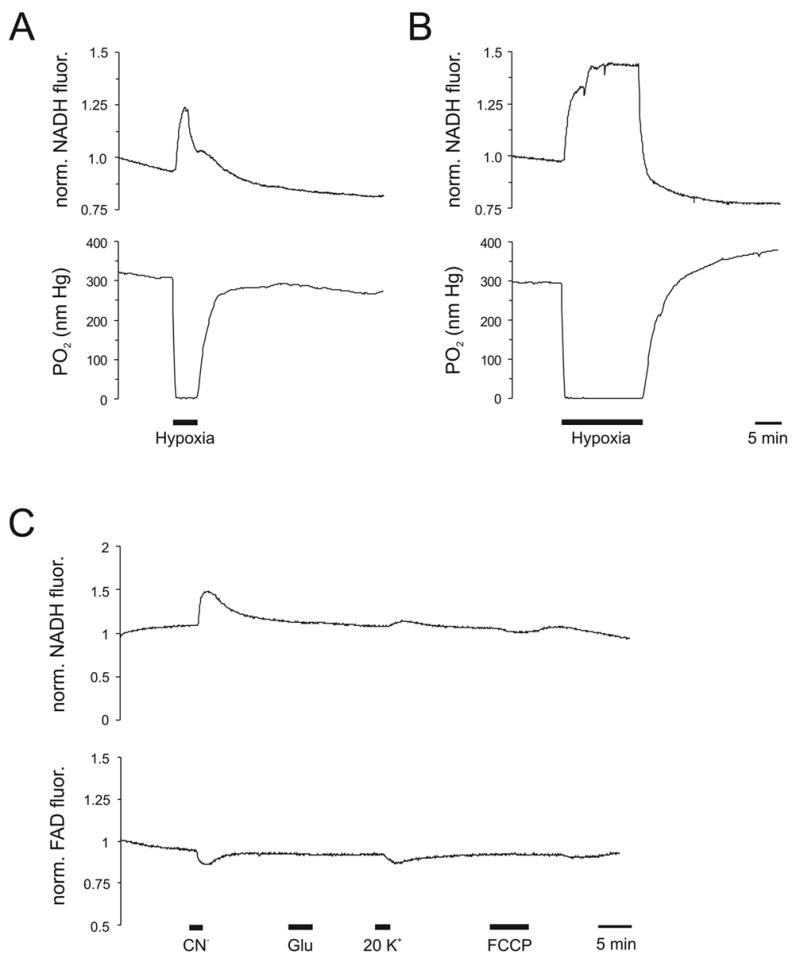
Mitochondria are critical for cellular adenosine triphosphate (ATP) production; however, recent studies suggest that these organelles fulfill a much broader range of tasks. For example, they are involved in the regulation of cytosolic Ca(2+) levels, intracellular pH and apoptosis, and are the major source of reactive oxygen species (ROS). Various reactive molecules that originate from mitochondria, such as ROS, are critical in pathological events, such as ischemia, as well as in physiological events such as long-term potentiation, neuronal-vascular coupling and neuronal-glial interactions. Due to their key roles in the regulation of several cellular functions, the dysfunction of mitochondria may be critical in various brain disorders. There has been increasing interest in the development of tools that modulate mitochondrial function, and the refinement of techniques that allow for real time monitoring of mitochondria, particularly within their intact cellular environment. Innovative imaging techniques are especially powerful since they allow for mitochondrial visualization at high resolution, tracking of mitochondrial structures and optical real time monitoring of parameters of mitochondrial function. The techniques discussed include classic imaging techniques, such as rhodamine-123, the highly advanced semi-conductor nanoparticles (quantum dots), and wide field microscopy as well as high-resolution multiphoton imaging. We have highlighted the use of these techniques to study mitochondrial function in brain tissue and have included studies from our laboratories in which these techniques have been successfully applied.


Figures

Figure 1
Figure 1. Mitochondrial physiology and pharmacological tools for the selective targeting of mitochondrial function
A) Mitochondria are descendents of prokaryotic “bacteria”, and therefore have the typical double-layered membrane surrounding the inner matrix space. An enlarged schematic view of a section of the mitochondrial membrane (green box) and its respiratory complexes is shown in the following panel. B) Schematic representation of the four complexes of the respiratory chain and the mitochondrial ATP synthase (F0F1 ATPase, complex V). Complexes I, III and IV are involved in proton pumping and thus the generation of the inwardly directed proton gradient across the inner mitochondrial membrane. Also, the main components of the mPTP are shown: ANT, CPD and VDAC. For clarity, only a small part of the outer mitochondrial membrane is shown. C) Summary of drugs targeting the individual respiratory complexes as well the F0F1 ATPase. Mitochondrial uncouplers act as protonophores and collapse the proton gradient across the inner mitochondrial membrane. CsA can prevent the assembly of the various subunits forming the mPTP.
Figure 2
Figure 2. Fluorescence-labeling of mitochondria reveals their organization in single neurons
A) Fluorescent labeling of mitochondria was achieved by transfection with CFPs targeted to cytochrome oxidase. Shown is a 3-dimensional reconstruction of a cultured neuron that was isolated from the medullary respiratory center (pre-Bötzinger complex) of a juvenile mouse. Note the long mitochondrial filaments, their high density in the soma region, their irregular distribution within the dendrites, and the accumulation of mitochondria in the synaptic terminals (arrows). Mitochondria were visualized by a custom-built 2-photon laser scanning microscope (Müller et al., 2003) at 800 nm excitation wavelength using a 63x 0.9 NA IR-optimized objective (Zeiss Achroplan), a pixel resolution of 250 nm/pixel and a pixel dwell time of 10 μs/pixel. Fluorescence intensity is coded in an 8-bit (256 level) pseudo-color mode ranging from black (low intensity = 0) to red (high intensity = 255) (Müller M. unpublished data). B, C) Individual mitochondria within the dendrites of respiratory neurons. Mitochondria were labeled by Rh123 (5 μg/ml, 30 min), which reports changes in ?? m and were scanned at a resolution of 60 nm/pixel. Exposing the cell shown in panel C to the complex I inhibitor rotenone (25 μM) induced high amplitude ?? m oscillations in some of the mitochondria. The changes in ?? m for those mitochondria indicated by the arrows are plotted in panel D (Müller M. unpublished data). D) ? ? m oscillations (“blinking”) upon administration of rotenone. Note the irregular ?? m changes occurring in the 5 mitochondria marked by the arrows in panel C and the subsequent loss of ?? m indicating complete mitochondrial depolarization as well as the irreversible effect of rotenone (Müller M. unpublished data).
Figure 3
Figure 3. Continuous monitoring of ?? m in single neurons and in acute tissue slices
A) Rh123 labeled mitochondria within a cultured respiratory neuron. Note the increase in background fluorescence and the loss of structural labeling, as the cells are exposed to CN (1 mM). Images were taken with a two-photon laser-scanning microscope using a 63x objective and a pixel resolution of 250 nm/pixel (Müller M. unpublished data). B) Time course of the changes in rhodamine fluorescence (normalized to pre-treatment baseline conditions) quantified in three regions of interest within the cytosol (arrow 1) and two mitochondrial clusters (arrows 2, 3) of the cell shown in panel A. Note the opposite changes in cytosolic and mitochondrial compartments. As the mitochondria depolarize in response to CN, Rh123 is released into the cytosol. Accordingly, cytosolic fluorescence markedly increases (black trace) while the fluorescence intensity of the mitochondrial structures decreases (blue and red traces). Upon washout of CN the mitochondria regain their ?? m and the Rh123 fluorescence returns to pre-treatment baseline conditions (Müller M. unpublished data). C) Measurement of Rh123 fluorescence in bulk-loaded slices. Using the appropriate filter sets, Rh123-fluorescence was monitored in combination with NADH autofluorescence, thereby obtaining changes in ?? m (Rh123) as well as mitochondrial respiration ([NADH]) and important details on mitochondrial dysfunction. Rh123-fluorescence and autofluorescence was captured with a highly sensitive CCD camera (QE, PCO) using a 40x 0.75NA water mmersion objective (Zeiss Achroplan) and quantified within a region of interest in stratum radiatum of an acute rat hippocampal slice. Note that in response to 1 mM CN, 500 μM glutamate and 1 μM FCCP, NADH fluorescence consistently increased at a steeper rate and reached its plateau earlier than Rh123 fluorescence, indicating that upon inhibition of mitochondrial respiration the ?? m can at least partially be maintained for a limited period of time (Müller M. unpublished data).
Figure 4
Figure 4. NADH/PO2 recordings during neuronal stimulation
A) Combined recording of NADH autofluorescence and PO2 from an acute hippocampal slice (incubated in an interface recording chamber) during repetitive electrical stimulation. Note the biphasic response in NADH levels, characterized by an initial decrease (oxidation) and followed by an increase (reduction phase). The initial decrease in NADH levels coincided with the onset of the massive drop in PO= indicating enhanced metabolic activity in this area of increased neural activity. Synaptic stimulation consisted of a 25 s stimulus train (0.1 ms pulses at 10 Hz) (Galeffi F. unpublished data). B) Simultaneous recordings of NADH and FAD autofluorescence during massive neuronal stimulation by increased extracellular K+ levels. Focally recorded field excitatory postsynaptic potentials were transiently depressed during and after the application of 50 mM K+, (~7 min) indicating depolarization block of synaptic transmission. Note that the recovery of synaptic function occurred faster than the normalization of NADH and FAD levels (Turner D.A. unpublished data).
Figure 5
Figure 5. Recordings of PO2, NADH and FAD autofluorescence as indicators of mitochondrial metabolism
A) Simultaneous recording of PO2 and NADH autofluorescence in an interface rat hippocampal slice in response to reversible hypoxia. Hypoxia was induced by aeration of the experimental chamber with 95%N2-5%O2, which resulted in the triggering of hSD within 2–3 min. Reoxygenation within 15s following the onset of hSD (DC potential recordings not shown) resulted in the return of PO2 and NADH levels to pre-treatment baselines (reprinted from Neuroscience, vol. 132, Foster KA, Beaver, CJ, Turner DA, ‘Interaction between tissue pO2 and NADH imaging during synaptic stimulation and hypoxia in rat hippocampal slices’, p 645–657, 2005, with permission from Elsevier). B) Responses of PO2 and NADH levels to prolonged hypoxia (95% N2, 5% O2) in an interface rat hippocampal slice. Hypoxia was continued for 10 min following the onset of hSD. After reoxygenation PO2 rapidly increased past baseline levels (overshoot) suggesting less O2 utilization due to irreversible neuronal impairment. In contrast, NADH decreased below baseline levels (hyperoxidation). The phenomenon of NADH hyperoxidation may occur as a result of cellular damage caused by increased levels of ROS following hypoxia (reprinted from Neuroscience, vol. 132, Foster KA, Beaver, CJ, Turner DA, ‘Interaction between tissue pO2 and NADH imaging during synaptic stimulation and hypoxia in rat hippocampal slices’, p 45–657, 2005, with permission from Elsevier). C) Simultaneous recording of NADH and FAD autofluorescence in a submerged acute hippocampal slice (stratum radiatum). Note the opposite changes in NADH and FAD levels in response to chemical anoxia (1 mM CN) or massive depolarization induced by elevating extracellular K+ to 20 mM. The application of CN and K+ lead to NADH accumulation as a result of impaired respiratory chain function. In contrast, application of 2 μM FCCP or 300 μM glutamate induced only moderate changes. NADH and FAD autofluorescence was measured by alternate excitation with 360 and 445 nm and recorded through a 450 nm dichroic mirror and a 510/40 nm bandpass (Müller M. unpublished data).
Figure 6
Figure 6. Visualization of the cellular generation of ROS
A) A cultured hippocampal neuron (loaded with HEt (5 μM)) was exposed to sequential applications of glutamate (500 μM), CN (1 mM), H2O2 (500 μM) and FCCP (1 μM). ROS production was increased after each of the stimuli as indicated by the increase in HEt fluorescence. The transient nature of these HEt signals and the decrease in baseline indicates that oxidized HEt is rapidly extruded from the cultured neurons (Müller M. unpublished data). B) Oxidation of HEt (5 μM) in a bulk loaded slice in response to CN, i.e., chemical anoxia. Application of CN within a few minutes resulted in the generation of ROS and thus increased HEt fluorescence. In contrast, the presence of the scavengers trolox (0.75 mM) and ascorbic acid (1 mM), decreased the oxidation of HEt by ~40%. The return of HEt fluorescence to baseline levels again suggests rapid extrusion of the oxidized dye from bulk-loaded slices (Müller M. unpublished data). C) Loading of H2DCF (100 μM) into hippocampal neurons via patch-pipette (Pusch and Neher, 1988). This is a technique often used in conjunction with fluorescence compounds such as Ca2+ indicators or Rh123 (Schuchmann et al., 2000). ROS generation is shown for an H2DCF-loaded hippocampal pyramidal neuron exposed to the mitochondrial uncoupler FCCP. The images show DCF fluorescence intensity recorded before and at the height of FCCP application; fluorescence intensity is displayed in an 8 bit (256 shades) gray scale color code. As a consequence of the higher dye-load, the FCCP-induced increase in DCF fluorescence was more pronounced than in cultured cells bulk loaded by external dye application. A frame rate of 15s was chosen to minimize oxidation of the redox-sensitive dye by excitation light (Müller M. unpublished data).

Similar articles

Cited by

References

    1. Ainscow EK, Mirshamsi S, Tang T, Ashford ML, Rutter GA. Dynamic imaging of free cytosolic ATP concentration during fuel sensing by rat hypothalamic neurones: evidence for ATP-independent control of ATP-sensitive K+ channels. J Physiol. 2002;544:429–45. - PMC - PubMed
    1. Albracht SP, van der Linden E, Faber BW. Quantitative amino acid analysis of bovine NADH: ubiquinone oxidoreductase (Complex I) and related enzymes. Consequences for the number of prosthetic groups. Biochim Biophys Acta. 2003;1557:41–9. - PubMed
    1. Allen NJ, Karadottir R, Attwell D. A preferential role for glycolysis in preventing the anoxic depolarization of rat hippocampal area CA1 pyramidal cells. J Neurosci. 2005;25:848–59. - PMC - PubMed
    1. Almeida A, Bolanos JP. A transient inhibition of mitochondrial ATP synthesis by nitric oxide synthase activation triggered apoptosis in primary cortical neurons. J Neurochem. 2001;77:676–90. - PubMed
    1. Amchenkova AA, Bakeeva LE, Chentsov YS, Skulachev VP, Zorov DB. Coupling membranes as energy-transmitting cables. I. Filamentous mitochondria in fibroblasts and mitochondrial clusters in cardiomyocytes. J Cell Biol. 1988;107:481–95. - PMC - PubMed

Publication types