. 2006 Sep;18(9):2294-313.
doi: 10.1105/tpc.106.043695. Epub 2006 Aug 18.

Tung tree DGAT1 and DGAT2 have nonredundant functions in triacylglycerol biosynthesis and are localized to different subdomains of the endoplasmic reticulum

Affiliations

Tung tree DGAT1 and DGAT2 have nonredundant functions in triacylglycerol biosynthesis and are localized to different subdomains of the endoplasmic reticulum

Jay M Shockey et al. Plant Cell. 2006 Sep.

Abstract

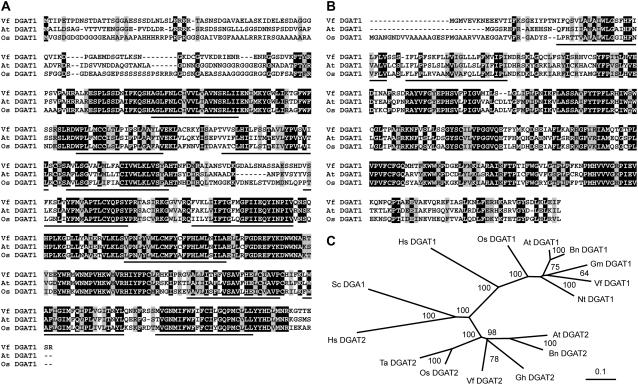
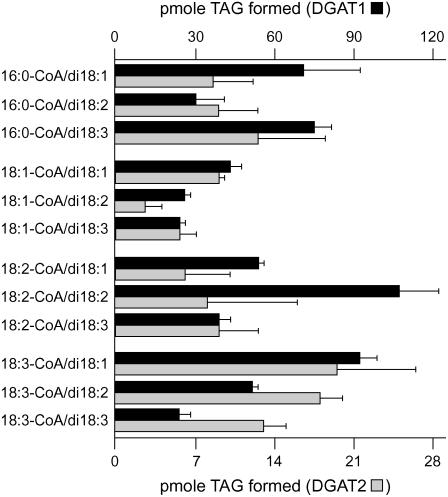
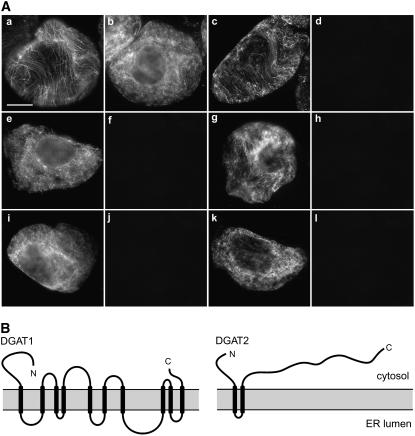
Seeds of the tung tree (Vernicia fordii) produce large quantities of triacylglycerols (TAGs) containing approximately 80% eleostearic acid, an unusual conjugated fatty acid. We present a comparative analysis of the genetic, functional, and cellular properties of tung type 1 and type 2 diacylglycerol acyltransferases (DGAT1 and DGAT2), two unrelated enzymes that catalyze the committed step in TAG biosynthesis. We show that both enzymes are encoded by single genes and that DGAT1 is expressed at similar levels in various organs, whereas DGAT2 is strongly induced in developing seeds at the onset of oil biosynthesis. Expression of DGAT1 and DGAT2 in yeast produced different types and proportions of TAGs containing eleostearic acid, with DGAT2 possessing an enhanced propensity for the synthesis of trieleostearin, the main component of tung oil. Both DGAT1 and DGAT2 are located in distinct, dynamic regions of the endoplasmic reticulum (ER), and surprisingly, these regions do not overlap. Furthermore, although both DGAT1 and DGAT2 contain a similar C-terminal pentapeptide ER retrieval motif, this motif alone is not sufficient for their localization to specific regions of the ER. These data suggest that DGAT1 and DGAT2 have nonredundant functions in plants and that the production of storage oils, including those containing unusual fatty acids, occurs in distinct ER subdomains.


Figures

Figure 1.
Figure 1.
Sequence Alignments and Phylogenetic Comparisons of DGAT1 and DGAT2 Proteins. (A) Multiple sequence alignment of deduced amino acid sequences of DGAT1 proteins from tung (Vf), Arabidopsis (At), and rice (Os). Identical residues are shaded black, and similar residues are shaded gray. Transmembrane domains, as predicted by the TMHMM server (http://www.cbs.dtu.dk/services/TMHMM-2.0/) (Krogh et al., 2001), are underlined. (B) Alignment of DGAT2 protein sequences. Proteins are labeled as in (A). (C) Phylogenetic analysis of various cloned and annotated DGAT sequences from plants, humans, and/or S. cerevisiae. Each plant species is represented by either DGAT1 or DGAT2, or both, depending on the availability of database sequences. The branch lengths of the tree are proportional to divergence. The 0.1 scale represents 10% change. Bootstrap values are shown in percentages at nodes. Proteins used in the analysis were DGAT1 and/or DGAT2 sequences from tung (Vf), Arabidopsis (At), Brassica napus (Bn), cotton (Gossypium hirsutum; Gh), rice (Os), soybean (Glycine max; Gm), tobacco (Nt), wheat (Triticum aestivum; Ta), human (Hs), and yeast (Sc).
Figure 2.
Figure 2.
Genomic Organization and Expression Patterns of Tung DGAT1 and DGAT2 Genes in Relation to Tung Seed Oil Biosynthesis. (A) Intron/exon structure of tung DGAT1 and DGAT2 genes. All exons (black boxes) and introns (lines) are drawn to scale, and the relative positions of restriction sites used for DNA gel blotting in (B) are shown. (B) DNA gel blot of tung genomic DNA digested with EcoRV, NcoI, or SacI and hybridized with digoxigenin (DIG)-labeled full-length ORF probes for either DGAT1 or DGAT2. DIG-labeled λ HindIII molecular mass markers, in kilobase pairs, are shown at left or right (M). (C) RNA gel blot analysis of DGAT1 and DGAT2 gene expression. RNA was extracted from leaves, flowers, and developing seeds, and DGAT1 and DGAT2 transcripts were characterized using gel blot analysis with DIG-labeled DGAT1- or DGAT2-specific probe. Ethidium bromide–stained rRNA from each sample is shown as a loading control. (D) Accumulation of tung oil in developing tung seeds. Tung fruit were harvested throughout the growing season (June 25 to September 3), and changes in total seed oil (percentage dry weight) and eleostearic acid (percentage [w/w] total fatty acid methyl esters) contents are shown.
Figure 3.
Figure 3.
Biochemical Activity of DGAT Enzymes in Vitro. Myc-tagged tung DGAT1 and DGAT2 were expressed individually in mutant yeast cells that lacked the ability to synthesize appreciable amounts of TAG, and then microsomal fractions were isolated and incubated with combinations of radiolabeled fatty acyl-CoAs and diacylglycerols. Fatty acyl-CoAs were palmitoyl-CoA (16:0-CoA), oleoyl-CoA (18:1-CoA), linoleoyl-CoA (18:2-CoA), and α-linolenoyl-CoA (18:3-CoA). Diacylglycerols were diolein (di18:1), dilinolein (di18:2), and dilinolenin (di18:3). Amounts (in picomoles per hour) of radiolabeled TAG formed per 25 μg of yeast microsomal membrane protein minus the amount of TAG produced in control experiments lacking exogenous DAG substrates are shown for each condition (average ± sd of three independent experiments). See Methods for additional details.
Figure 4.
Figure 4.
Functional Analysis of DGAT Enzymes in Vivo. Wild-type (WT) and mutant (MUT; lacking the ability to produce TAGs) yeast cells were cultivated in the presence of tung oil and a nonspecific lipase, cells were harvested, and lipids were extracted for the identification of eleostearoyl-containing compounds. Yeast cells were also transformed with an empty plasmid (pYes3) or a plasmid expressing yeast DGA1, tung DGAT1, or tung DGAT2. Strain and plasmid combinations are shown along the bottom of (A) and at right in (B). (A) The top panel shows the percentage of eleostearic acid in yeast cells complemented with various DGAT1 or DGAT2 enzymes, as determined by GC-FID analysis (average ± sd, n = 3). The bottom panel shows a TLC separation of various lipid classes. Positions of lipid standards are shown at left: diacylglycerol (DAG), free fatty acids (FFA), phospholipids (PL), sterol esters (ST), and triacylglycerols (TAG). Samples are representative of three independent experiments. Note the reduction of eleostearic acid (top panel) and the absence of TAGs (bottom panel) in the MUT+pYes3 yeast strain. (B) HPLC-PDA analysis of yeast lipids. Lipids were extracted from yeast cells and then separated and analyzed by HPLC with PDA detection. The PDA device monitored UV light absorbance from 210 to 345 nm, which allowed the detection of eleostearoyl-containing compounds by virtue of the characteristic UV light absorbance spectrum of eleostearic acid (see Supplemental Figure 1 online for a complete PDA data set of WT+pYes3 lipids and a comparison with a tung oil standard). Each chromatogram shown represents the 271-nm absorbance trace (λmax of eleostearic acid) extracted from the complete PDA data set. TAGs were identified by comparison of peak retention times and retention times of authentic standards, and assignments were confirmed by liquid chromatography-mass spectrometry (LC-MS) (see Supplemental Figure 2 online). Each TAG peak is labeled according to the three fatty acyl side chains, although stereospecific positions are not known. Fatty acid abbreviations are as follows: eleostearic (E), linoleic (L), oleic (O), palmitic (P), palmitoleic (Po), and stearic (S). Each chromatogram is representative of three independent experiments.
Figure 5.
Figure 5.
Subcellular Localization of DGAT1 and DGAT2 in Tobacco BY-2 Cells. BY-2 cells were transformed transiently with either myc-DGAT1 or myc-DGAT2, fixed in formaldehyde at 4 h after biolistic bombardment, and then processed for immunofluorescence CLSM. Hatched boxes represent the portion of the cell shown at higher magnification in the panels below. The yellow/orange color in the merged images indicates the colocalization of expressed myc-DGAT1 or myc-DGAT2 and endogenous ER stained with ConA conjugated to Alexa 594 in the same cells; white arrowheads also indicate colocalizations. Black arrowheads indicate regions of ConA-stained ER that contain relatively low immunofluorescence attributable to myc-DGAT1 or myc-DGAT2. Bars = 10 μm.
Figure 6.
Figure 6.
FRAP Analysis of GFP-DGAT2 in BY-2 Cells. (A) Selective photobleaching of GFP-DGAT2 fluorescence in a representative transiently transformed living BY-2 cell at 4 h after biolistic bombardment. The outlined area (ovals) represents a discrete region of the ER containing GFP-DGAT2 that was photobleached and then monitored over time for the recovery of fluorescence. The time lapse is indicated in seconds at top left of each frame in the top row of images, with the last prebleached image collected represented as 8 s. The 16-s time point represents the first image collected after the photobleaching event. The other image of the postbleach recovery series (124 s) illustrates the recovery of GFP-DGAT2 fluorescence in the ER subdomain. The portion of the GFP-DGAT2–transformed cell at each time point outlined by the hatched boxes in the top row of images is shown at higher magnification in the bottom row of images; arrowheads denote the specific region of the ER containing GFP-DGAT2 that was photobleached. Note that the CLSM settings (laser power and detection gain) for imaging GFP-DGAT2 fluorescence in the BY-2 cell shown here were higher than those used for most other cells examined during FRAP experiments; lower CLSM settings in these other experiments were necessary to reduce fluorescence oversaturation. Bar = 10 μm. (B) Fluorescence intensity recovery plots of GFP-DGAT2 in an ER subdomain in either the BY-2 cell shown in (A) (closed circles) or another representative GFP-DGAT2–transformed BY-2 cell that was fixed in formaldehyde at 4 h after biolistic bombardment and then subjected to photobleaching (open circles). Both fluorescence recovery curves are expressed as fluorescence percentage over the entire time series and represent the relative fluorescence intensity of a measured GFP-DGAT2–containing ER structure that was normalized to the nonbleached fluorescence in another area of the cell. One hundred percent fluorescence indicates the normalized prebleach fluorescence intensity.
Figure 7.
Figure 7.
Subcellular Localization of Coexpressed DGAT1 and DGAT2 in BY-2 Cells. BY-2 cells were cotransformed with either epitope- or GFP-tagged versions of tung DGAT1, DGAT2, or Cb5, fixed in formaldehyde at 4 h after biolistic bombardment, and then processed for immunofluorescence CLSM. Hatched boxes represent the portion of the cell shown at higher magnification in the panels below. Note that the fluorescence patterns attributable to coexpressed myc-DGAT1 and GFP-DGAT2 in the same cell are distinctly different; compare the nonoverlapping red and green fluorescence, respectively, in the merged images. Obvious colocalizations between coexpressed HA-DGAT2 and myc-DGAT2 in the same cell are indicated with white arrowheads. Arrowheads also highlight regions of the ER where HA-DGAT2 and myc-Cb5 colocalize in the same cotransformed cell. Endogenous ER in all cotransformed cells was stained with ConA conjugated to Alexa 594; fluorescence attributable to ConA staining is pseudocolored white. Bars = 10 μm.
Figure 8.
Figure 8.
Topological Orientation of DGAT1 and DGAT2 in ER Membranes. (A) Nontransformed ([a] to [d]) and transiently transformed ([e] to [l]) BY-2 cells were fixed in formaldehyde and permeabilized using either Triton X-100 ([a] and [b]), which perforates all cellular membranes, or digitonin ([c] to [l]), which selectively permeabilizes the plasma membrane, then cells were processed for immunofluorescence microscopy. Bar in (a) = 10 μm. (a) and (b) Immunostaining attributable to endogenous tubulin in cytosolic microtubules (a) and calreticulin in the ER lumen (b) in the same nontransformed, Triton X-100–permeabilized cells. (c) and (d) Presence of cytosolic tubulin (c) but lack of immunostaining attributable to endogenous calreticulin (d) in the same digitonin-permeabilized cells. (e) to (l) Immunostaining attributable to transiently expressed myc-DGAT1 (e), myc-DGAT2 (g), DGAT1-myc (i), or DGAT2-myc (k) but absence of fluorescence attributable to endogenous calreticulin in the corresponding ([f], [h], [j], and [l]) same digitonin-permeabilized cells. (B) Predicted topological maps of DGAT1 and DGAT2. Regions in DGAT1 and DGAT2 proposed to be hydrophobic membrane-spanning domains or hydrophilic domains facing the cytosol or ER lumen were identified using the TMHMM program (version 2.0). Based on the results presented in (A), the N and C termini of DGAT1 and DGAT2 are predicted to face the cytosol.
Figure 9.
Figure 9.
Localization of Various GFP-Cf9 Fusion Proteins in Onion Epidermal Cells. (A) Deduced C-terminal amino acid sequence alignment of various DGAT1 and DGAT2 proteins from tung (Vf), Arabidopsis (At), and rice (Os). The putative aromatic amino acid–enriched ER retrieval motif in both groups of proteins is boxed. (B) Schematic of the GFP-Cf9 chimeric proteins and their corresponding intracellular localization in transformed onion epidermal cells as ER, Golgi, or plasma membrane (PM). The GFP-Cf9 chimeric protein is drawn to scale and consists of an N-terminal Arabidopsis chitinase signal peptide (black box), the GFP (gray box), and C-terminal amino acid sequences from Cf9 (white box), including the protein's single TMD (lined box) and dilysine ER retrieval motif (underlined). The C-terminal Cf9 sequences were modified by replacing the protein's dilysine motif with either the tung DGAT1 or DGAT2 C-terminal sequence, including each protein's putative pentapeptide ER retrieval motif (underlined). Modified amino acid residues in the various GFP-Cf9 or GFP-Cf9-DGAT chimeric proteins are shown in boldface. (C) Localization of various GFP-Cf9 and RFP fusion proteins in onion epidermal cells. Onion epidermal peels were either bombarded with DNA encoding different GFP-Cf9 chimeric proteins, as illustrated in (B), or cobombarded with DNA encoding a GFP-Cf9 chimeric protein and either RFP-HDEL or RFP-RhoGTPase. Cells were then incubated for 8 h in the dark and visualized using either fluorescence or bright-field microscopy. Each representative micrograph is labeled at top left with either the name of the transiently expressed GFP-Cf9 fusion protein or the name of the coexpressed RFP fusion protein. Also shown are the corresponding bright-field micrographs of cells cotransformed with either GFP-Cf9 and RFP-HDEL or GFP-Cf9KKΔNN and RFP-RhoGTPase (two panels at top right). Arrowheads indicate individual Golgi complexes in cells transformed with GFP-Cf9-DGAT2 or GFP-Cf9-DGAT2+13. Bar = 100 μm.
Figure 10.
Figure 10.
Localization of Coexpressed DGAT1 or DGAT2 and GFP-Cf9 Fusion Proteins in BY-2 Cells. BY-2 cells were cotransformed with either myc-DGAT1 or myc-DGAT2 and GFP-Cf9-DGAT1 or GFP-Cf9-DGAT2+18 (see Figure 9B), fixed in formaldehyde at 4 h after biolistic bombardment, and then processed for immunofluorescence CLSM. Hatched boxes represent the portion of the cell shown at higher magnification in the panels below. Black arrowheads indicate regions of ConA-stained ER that contain GFP-Cf9-DGAT1 or GFP-Cf9-DGAT2+18 but relatively low immunofluorescence attributable to myc-DGAT1 or myc-DGAT2, respectively; compare the colocalization of GFP-Cf9-DGAT1 or GFP-Cf9-DGAT2+18 and ConA-stained ER in the same cells. The yellow/orange color in the merged images indicates colocalizations of coexpressed myc-DGAT1 or myc-DGAT2 and GFP-Cf9-DGAT1 or GFP-Cf9-DGAT2+18, respectively, in the same cells; white arrowheads indicate colocalizations. Fluorescence attributable to ConA conjugated to Alexa 594 is pseudocolored white. Bars = 10 μm.

References

    1. Banjoko, A., and Trelease, R.N. (1995). Development and application of an in vivo plant peroxisome import system. Plant Physiol. 107 1201–1208. - PMC - PubMed
    1. Benghezal, M., Wasteneys, G.O., and Jones, D.A. (2000). The C-terminal dilysine motif confers endoplasmic reticulum localization to type I membrane proteins in plants. Plant Cell 12 1179–1201. - PMC - PubMed
    1. Bischoff, F., Vahlkamp, L., Molendijk, A., and Palme, K. (2000). Localization of AtROP4 and AtROP6 and interaction with the guanine nucleotide dissociation inhibitor AtRhoGDI1 from Arabidopsis. Plant Mol. Biol. 42 515–530. - PubMed
    1. Bland, J.M., Park, Y.I., Raina, A.K., Dickens, J.C., and Hollister, B. (2004). Trilinolein identified as a sex-specific component of tergal glands in alates of Coptotermes formosanus. J. Chem. Ecol. 30 835–849. - PubMed
    1. Bligh, E.G., and Dyer, W.J. (1959). A rapid method of total lipid extraction and purification. Can. J. Biochem. Physiol. 37 911–917. - PubMed

Publication types

MeSH terms

LinkOut - more resources