

Transcriptional coordination of the metabolic network in Arabidopsis
- PMID: 16920875
- PMCID: PMC1586052
- DOI: 10.1104/pp.106.080358
Transcriptional coordination of the metabolic network in Arabidopsis
Abstract
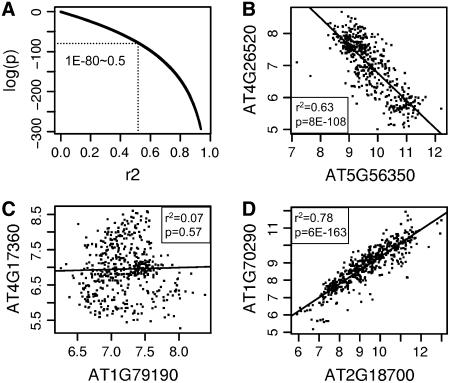
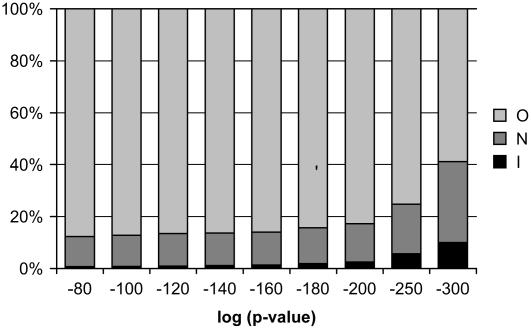
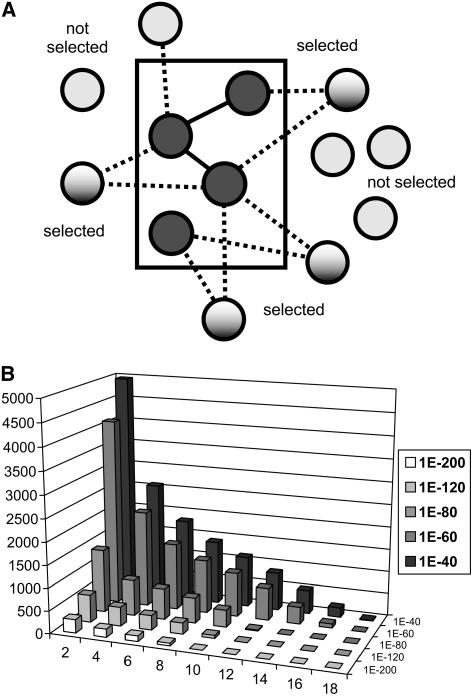
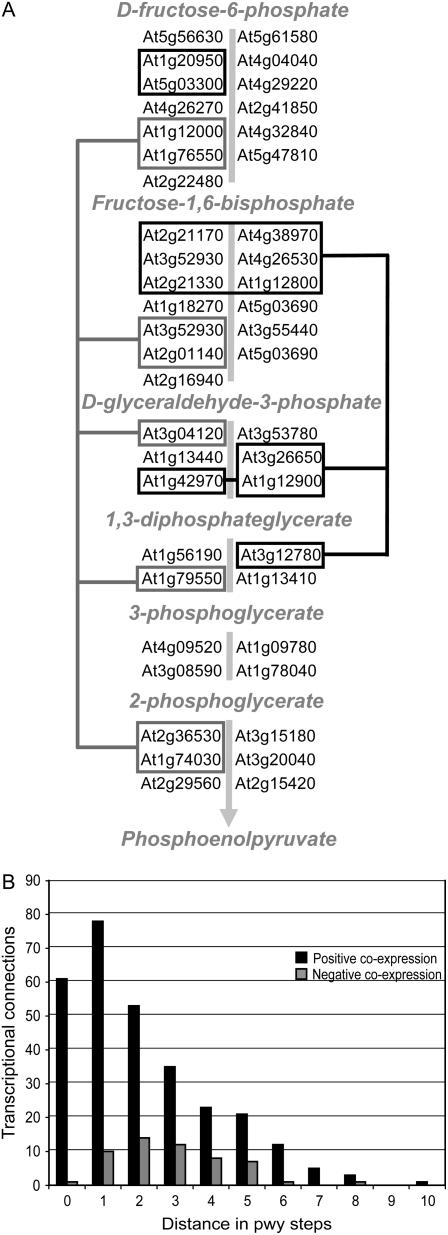
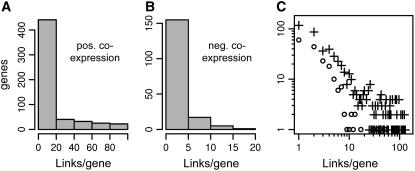
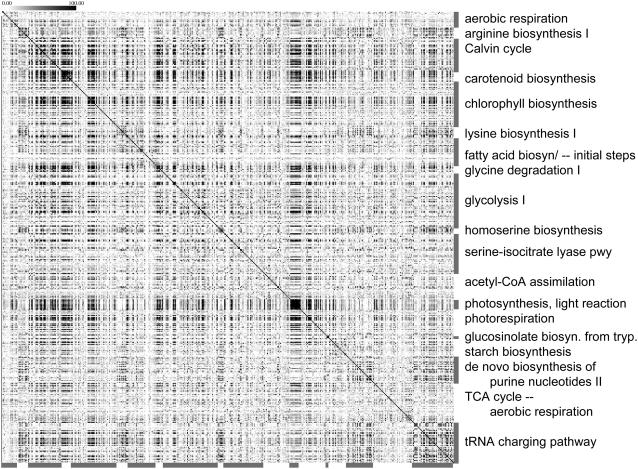
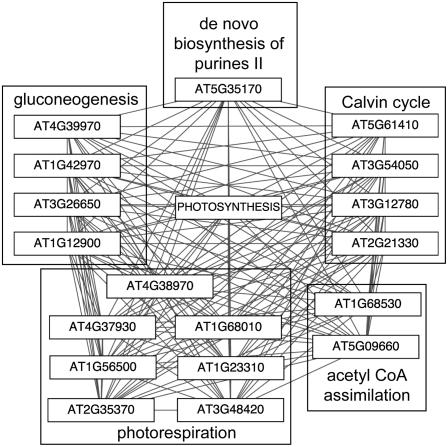
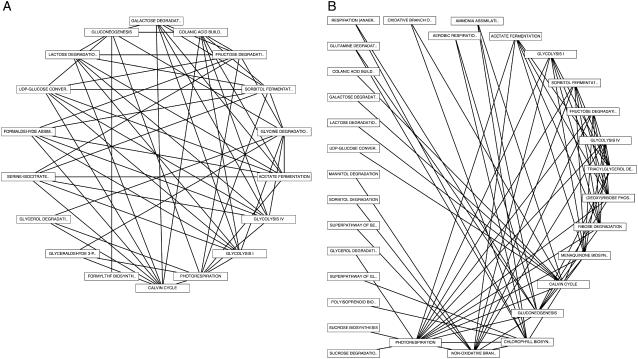
Patterns of coexpression can reveal networks of functionally related genes and provide deeper understanding of processes requiring multiple gene products. We performed an analysis of coexpression networks for 1,330 genes from the AraCyc database of metabolic pathways in Arabidopsis (Arabidopsis thaliana). We found that genes associated with the same metabolic pathway are, on average, more highly coexpressed than genes from different pathways. Positively coexpressed genes within the same pathway tend to cluster close together in the pathway structure, while negatively correlated genes typically occupy more distant positions. The distribution of coexpression links per gene is highly skewed, with a small but significant number of genes having numerous coexpression partners but most having fewer than 10. Genes with multiple connections (hubs) tend to be single-copy genes, while genes with multiple paralogs are coexpressed with fewer genes, on average, than single-copy genes, suggesting that the network expands through gene duplication, followed by weakening of coexpression links involving duplicate nodes. Using a network-analysis algorithm based on coexpression with multiple pathway members (pathway-level coexpression), we identified and prioritized novel candidate pathway members, regulators, and cross pathway transcriptional control points for over 140 metabolic pathways. To facilitate exploration and analysis of the results, we provide a Web site (http://www.transvar.org/at_coexpress/analysis/web) listing analyzed pathways with links to regression and pathway-level coexpression results. These methods and results will aid in the prioritization of candidates for genetic analysis of metabolism in plants and contribute to the improvement of functional annotation of the Arabidopsis genome.
Figures
Similar articles
-
Transcriptome coexpression analysis using ATTED-II for integrated transcriptomic/metabolomic analysis.Methods Mol Biol. 2013;1011:317-26. doi: 10.1007/978-1-62703-414-2_25. Methods Mol Biol. 2013. PMID: 23616007
-
Differential Coexpression Analysis Reveals Extensive Rewiring of Arabidopsis Gene Coexpression in Response to Pseudomonas syringae Infection.Sci Rep. 2016 Oct 10;6:35064. doi: 10.1038/srep35064. Sci Rep. 2016. PMID: 27721457 Free PMC article.
-
The transcript and metabolite networks affected by the two clades of Arabidopsis glucosinolate biosynthesis regulators.Plant Physiol. 2008 Dec;148(4):2021-49. doi: 10.1104/pp.108.124784. Epub 2008 Oct 1. Plant Physiol. 2008. PMID: 18829985 Free PMC article.
-
Arabidopsis paves the way: genomic and network analyses in crops.Curr Opin Biotechnol. 2011 Apr;22(2):260-70. doi: 10.1016/j.copbio.2010.11.010. Epub 2010 Dec 15. Curr Opin Biotechnol. 2011. PMID: 21167706 Review.
-
Network building: transcriptional circuits in the root.Curr Opin Plant Biol. 2004 Oct;7(5):582-8. doi: 10.1016/j.pbi.2004.07.010. Curr Opin Plant Biol. 2004. PMID: 15337102 Review.
Cited by
-
An Integrated Bioinformatics Analysis Reveals Divergent Evolutionary Pattern of Oil Biosynthesis in High- and Low-Oil Plants.PLoS One. 2016 May 9;11(5):e0154882. doi: 10.1371/journal.pone.0154882. eCollection 2016. PLoS One. 2016. PMID: 27159078 Free PMC article.
-
Unusual DNA-binding properties of the Arabidopsis thaliana WRKY50 transcription factor at target gene promoters.Plant Cell Rep. 2021 Jan;40(1):69-83. doi: 10.1007/s00299-020-02611-2. Epub 2020 Oct 2. Plant Cell Rep. 2021. PMID: 33006643 Free PMC article.
-
Co-expression of cell-wall related genes: new tools and insights.Front Plant Sci. 2012 May 3;3:83. doi: 10.3389/fpls.2012.00083. eCollection 2012. Front Plant Sci. 2012. PMID: 22645599 Free PMC article.
-
The Arabidopsis gene co-expression network.Plant Direct. 2022 Apr 26;6(4):e396. doi: 10.1002/pld3.396. eCollection 2022 Apr. Plant Direct. 2022. PMID: 35492683 Free PMC article.
-
DeGNServer: deciphering genome-scale gene networks through high performance reverse engineering analysis.Biomed Res Int. 2013;2013:856325. doi: 10.1155/2013/856325. Epub 2013 Nov 17. Biomed Res Int. 2013. PMID: 24328032 Free PMC article.
References
-
- Albert R (2005) Scale-free networks in cell biology. J Cell Sci 118: 4947–4957 - PubMed
-
- Albert R, Jeong H, Barabasi AL (2000) Error and attack tolerance of complex networks. Nature 406: 378–382 - PubMed
-
- Daniel WW (2004) Biostatistics: A Foundation for Analysis in the Health Sciences, Ed 8. Wiley, New York
Publication types
MeSH terms
Substances
LinkOut - more resources
Full Text Sources
Molecular Biology Databases
