

Tramadol, but not its major metabolite (mono-O-demethyl tramadol) depresses compound action potentials in frog sciatic nerves
- PMID: 16921387
- PMCID: PMC2014268
- DOI: 10.1038/sj.bjp.0706868
Tramadol, but not its major metabolite (mono-O-demethyl tramadol) depresses compound action potentials in frog sciatic nerves
Abstract
Background and purpose: Although tramadol is known to exhibit a local anaesthetic effect, how tramadol exerts this effect is not understood fully.
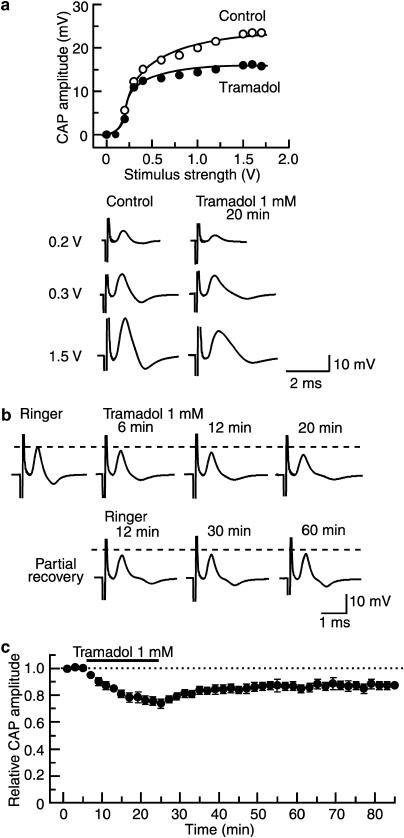
Experimental approach: The effects of tramadol and its metabolite mono-O-demethyl-tramadol (M1) on compound action potentials (CAPs) were examined by applying the air-gap method to frog sciatic nerves, and the results were compared with those of other local anaesthetics, lidocaine and ropivacaine.
Key results: Tramadol reduced the peak amplitude of the CAP in a dose-dependent manner (IC50=2.3 mM). On the other hand, M1 (1-2 mM), which exhibits a higher affinity for mu-opioid receptors than tramadol, did not affect CAPs. These effects of tramadol were resistant to the non-selective opioid receptor antagonist naloxone and the mu-opioid receptor agonist, DAMGO, did not affect CAPs. This tramadol action was not affected by a combination of the noradrenaline uptake inhibitor, desipramine, and the 5-hydroxytryptamine uptake inhibitor, fluoxetine. Lidocaine and ropivacaine also concentration-dependently reduced CAP peak amplitudes with IC50 values of 0.74 and 0.34 mM, respectively.
Conclusions and implications: These results indicate that tramadol reduces the peak amplitude of CAP in peripheral nerve fibres with a potency which is less than those of lidocaine and ropivacaine, whereas M1 has much less effect on CAPs. This action of tramadol was not produced by activation of mu-opioid receptors nor by inhibition of noradrenaline and 5-hydroxytryptamine uptake. It is suggested that the methyl group present in tramadol but not in M1 may play an important role in producing nerve conduction block.
Figures


Similar articles
-
Inhibitory effects of opioids on compound action potentials in frog sciatic nerves and their chemical structures.Life Sci. 2008 Aug 1;83(5-6):198-207. doi: 10.1016/j.lfs.2008.06.002. Epub 2008 Jun 14. Life Sci. 2008. PMID: 18593589
-
Effects of tramadol on nerve action potentials in rat: comparisons with benzocaine and lidocaine.Int J Neurosci. 2005 Mar;115(3):339-49. doi: 10.1080/00207450590520948. Int J Neurosci. 2005. PMID: 15804720
-
Comparative effects of lidocaine and tramadol on injured peripheral nerves.Eur J Pharmacol. 2006 Aug 14;543(1-3):54-62. doi: 10.1016/j.ejphar.2006.06.008. Epub 2006 Jun 10. Eur J Pharmacol. 2006. PMID: 16822495
-
[Pharmacology of tramadol].Drugs. 1997;53 Suppl 2:18-24. doi: 10.2165/00003495-199700532-00006. Drugs. 1997. PMID: 9190321 Review. French.
-
The pharmacology of tramadol.Drugs. 1994;47 Suppl 1:3-7. doi: 10.2165/00003495-199400471-00003. Drugs. 1994. PMID: 7517823 Review.
Cited by
-
Additives to local anesthetics for peripheral nerve blockade.Int Anesthesiol Clin. 2011 Fall;49(4):104-16. doi: 10.1097/AIA.0b013e31820e4a49. Int Anesthesiol Clin. 2011. PMID: 21956081 Free PMC article. Review.
-
Non-invasive detection of animal nerve impulses with an atomic magnetometer operating near quantum limited sensitivity.Sci Rep. 2016 Jul 15;6:29638. doi: 10.1038/srep29638. Sci Rep. 2016. PMID: 27417378 Free PMC article.
-
Quantifying Demyelination in NK venom treated nerve using its electric circuit model.Sci Rep. 2016 Mar 2;6:22385. doi: 10.1038/srep22385. Sci Rep. 2016. PMID: 26932543 Free PMC article.
-
Inhibition of the compound action potentials of frog sciatic nerves by aroma oil compounds having various chemical structures.Pharmacol Res Perspect. 2015 Mar;3(2):e00127. doi: 10.1002/prp2.127. Epub 2015 Mar 13. Pharmacol Res Perspect. 2015. PMID: 26038703 Free PMC article.
-
Bisphenol A inhibits compound action potentials in the frog sciatic nerve in a manner independent of estrogen receptors.Biochem Biophys Rep. 2017 Mar 23;10:145-151. doi: 10.1016/j.bbrep.2017.03.006. eCollection 2017 Jul. Biochem Biophys Rep. 2017. PMID: 28955742 Free PMC article.
References
-
- Altunkaya H, Ozer Y, Kargi E, Babuccu O. Comparison of local anaesthetic effects of tramadol with prilocaine for minor surgical procedures. Br J Anaesthet. 2003;90:320–322. - PubMed
-
- Altunkaya H, Ozer Y, Kargi E, Ozkocak I, Hosnuter M, Demirel CB, et al. The postoperative analgesic effect of tramadol when used as subcutaneous local anesthetic. Anesth Analg. 2004;99:1461–1464. - PubMed
-
- Atanassoff PG, Ocampo CA, Bande MC, Hartmannsgruber MWB, Halaszynski TM. Ropivacaine 0.2% and lidocaine 0.5% for intravenous regional anesthesia in outpatient surgery. Anesthesiology. 2001;95:627–631. - PubMed
-
- Bader AM, Datta S, Flanagan H, Covino BG. Comparison of bupivacaine- and ropivacaine-induced conduction blockade in the isolated rabbit vagus nerve. Anesth Analg. 1989;68:724–727. - PubMed
-
- Chan VWS, Weisbrod MJ, Kaszas Z, Dragomir C. Comparison of ropivacaine and lidocaine for intravenous regional anesthesia in volunteers: a preliminary study on anesthetic efficacy and blood level. Anesthesiology. 1999;90:1602–1608. - PubMed
MeSH terms
Substances
LinkOut - more resources
Full Text Sources
Research Materials
Miscellaneous
