Review
. 2007 Jan-Feb;26(1):51-78.
doi: 10.1002/mas.20108.

Mass spectrometry-based metabolomics

Affiliations
Review

Mass spectrometry-based metabolomics

Katja Dettmer et al. Mass Spectrom Rev. 2007 Jan-Feb.

Abstract

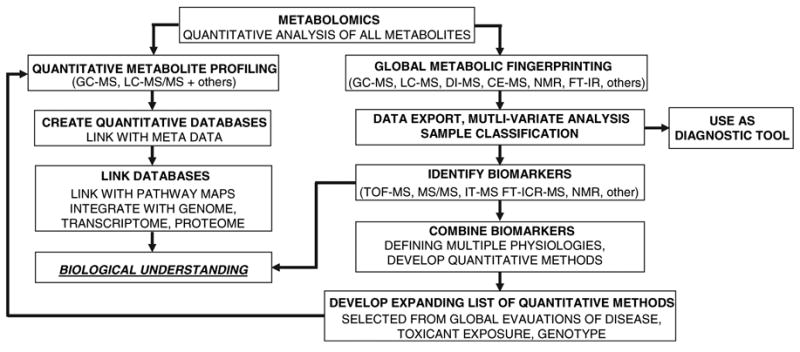
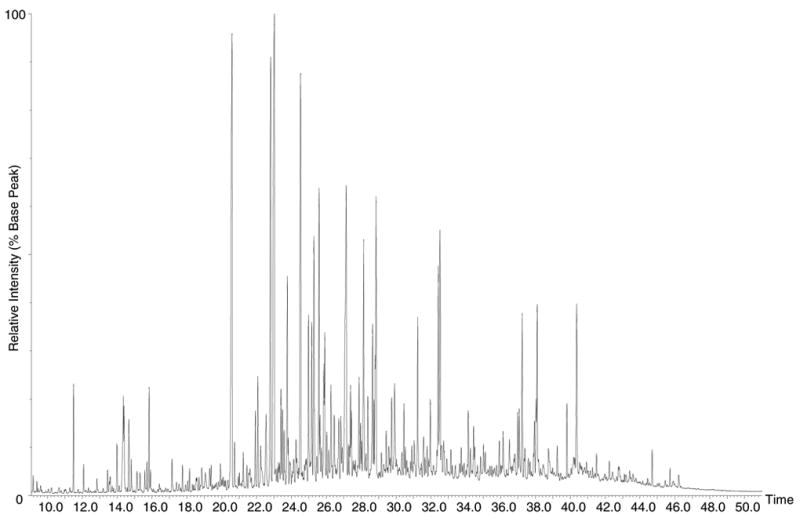
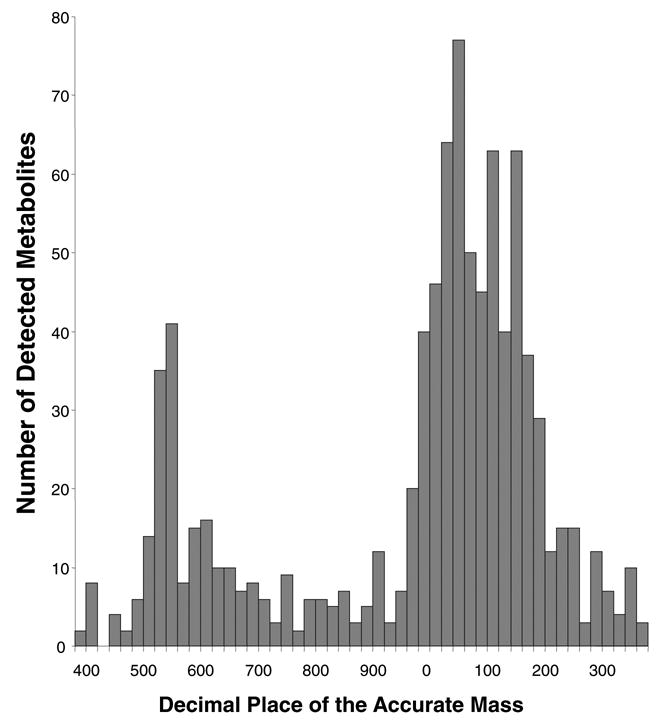
This review presents an overview of the dynamically developing field of mass spectrometry-based metabolomics. Metabolomics aims at the comprehensive and quantitative analysis of wide arrays of metabolites in biological samples. These numerous analytes have very diverse physico-chemical properties and occur at different abundance levels. Consequently, comprehensive metabolomics investigations are primarily a challenge for analytical chemistry and specifically mass spectrometry has vast potential as a tool for this type of investigation. Metabolomics require special approaches for sample preparation, separation, and mass spectrometric analysis. Current examples of those approaches are described in this review. It primarily focuses on metabolic fingerprinting, a technique that analyzes all detectable analytes in a given sample with subsequent classification of samples and identification of differentially expressed metabolites, which define the sample classes. To perform this complex task, data analysis tools, metabolite libraries, and databases are required. Therefore, recent advances in metabolomics bioinformatics are also discussed.


Figures

FIGURE 1
FIGURE 1
The “Omics” cascade comprises complex datasets that as an entity comprehensively describe the response of biological systems to disease, genetic, and environmental perturbations. The most powerful database will integrate data from all omic levels. However, of these databases the metabolome is the most predictive of phenotype.
FIGURE 2
FIGURE 2
Bibliographic search in Chemical Abstracts Plus containing the keywords metabolomics and metabonomics using SciFinder Scholar (as of June 10th, 2005). A total of 696 journal articles were found. The dataset was further mined using the search parameter mass spectrometry or NMR. The diagram shows the frequency of total metabolomics publications (black squares), publications that mention mass spectrometry (black bars) and NMR (gray bars) from 1999 to 2004.
FIGURE 3
FIGURE 3
Strategies for metabolomic investigations.
FIGURE 4
FIGURE 4
Simplified workflow for a metabolic fingerprinting analysis.
FIGURE 5
FIGURE 5
Product ion spectra of dipentadecyl-phosphatidylcholine using ESI in positive [M + H]+ (upper spectrum) and negative mode [M +HCOO] (lower spectrum).
FIGURE 6
FIGURE 6
Combined MS spectra from 2.5 to 35 min obtained after online-SPE extraction of 10 μL human urine, reversed phase HPLC separation, and TOF-MS detection (LCT, Micromass, UK) with ESI in positive mode. Expanded section of the spectrum illustrates the need for high-mass resolution to distinguish isobaric peaks, which originate from different metabolites as shown by the extracted-ion chromatogram. The third extracted-ion chromatogram shows that m/z 202.129 originates from two different metabolites that can be chromatographically separated. Direct infusion would not readily distinguish these two metabolites.
FIGURE 7
FIGURE 7
Online SPE extraction of (A) 10 μL saline solution and (B) 10 μL rat urine spiked with internal standards coupled to direct infusion analysis using ESI in positive mode and TOF-MS detection (LCT, Micromass). Internal standards used: 1. Indole-3-acetic acid-d2, 2. 11-Aminoundecanoic acid, 3. Melatonin-d4. Rat urine spectrum (B) shows significant ion suppression for the internal standards in the range of 60%.
FIGURE 8
FIGURE 8
Simultaneously acquired total-ion chromatogram with ESI in positive (upper chromatogram) and negative (lower chromatogram) mode obtained by online SPE extraction of 10 μL human urine, RP-chromatography using gradient elution and TOF-MS detection (LCT, Micromass).
FIGURE 9
FIGURE 9
Total ion chromatogram of a human urine (1 mL) extract after silylation with MSTFA and GC-MS analysis. Peak deconvolution using AMDIS resulted in 1,582 components.
FIGURE 10
FIGURE 10
Diagram showing different approaches for metabolomics data analysis. A: Mass-intensity vectors in each scan of the raw LC-MS or GC-MS data are binned to form mass-aligned vectors of uniform length. B: Scans across chromatogram area of interest are combined. C: Components are detected in binned data by peak detection algorithms in all scans belonging to one bin (selected ion chromatograms) or several bins (peak deconvolution). D: Peaks are detected in raw data using peak picking algorithms.
FIGURE 11
FIGURE 11
A histogram of decimal places of metabolite accurate masses which demonstrates the optimum bin margins. Accurate masses of 1,008 metabolites were used which were discovered by MarkerLynx (MicroMass, UK) in a typical LC-MS fingerprint of cell culture media samples.

Similar articles

Cited by

References

    1. Adahchour M, Brandt M, Baier HU, Vreuls RJ, Batenburg AM, Brinkman UA. Comprehensive two-dimensional gas chromatography coupled to a rapid-scanning quadrupole mass spectrometer: Principles and applications. J Chromatogr A. 2005;1067:245–254. - PubMed
    1. Aharoni A, Ric de Vos CH, Verhoeven HA, Maliepaard CA, Kruppa G, Bino R, Goodenowe DB. Nontargeted metabolome analysis by use of Fourier transform ion cyclotron mass spectrometry. Omics. 2002;6:217–234. - PubMed
    1. Allen J, Davey HM, Broadhurst D, Heald JK, Rowland JJ, Oliver SG, Kell DB. High-throughput classification of yeast mutants for functional genomics using metabolic footprinting. Nat Biotechnol. 2003;21:692–696. - PubMed
    1. Allen J, Davey HM, Broadhurst D, Rowland JJ, Oliver SG, Kell DB. Discrimination of modes of action of antifungal substances by use of metabolic footprinting. Appl Environ Microbiol. 2004;70:6157–6165. - PMC - PubMed
    1. Balazy M. Eicosanomics: Targeted lipidomics of eicosanoids in biological systems. Prostaglandins Other Lipid Mediat. 2004;73:173–180. - PubMed

Publication types

MeSH terms

LinkOut - more resources