

The monosaccharide transporter gene family in land plants is ancient and shows differential subfamily expression and expansion across lineages
- PMID: 16923188
- PMCID: PMC1578591
- DOI: 10.1186/1471-2148-6-64
The monosaccharide transporter gene family in land plants is ancient and shows differential subfamily expression and expansion across lineages
Abstract
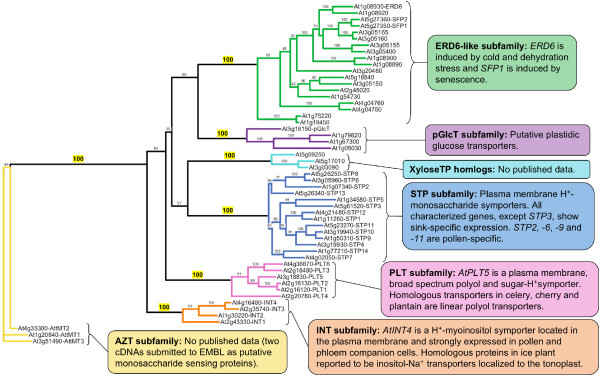
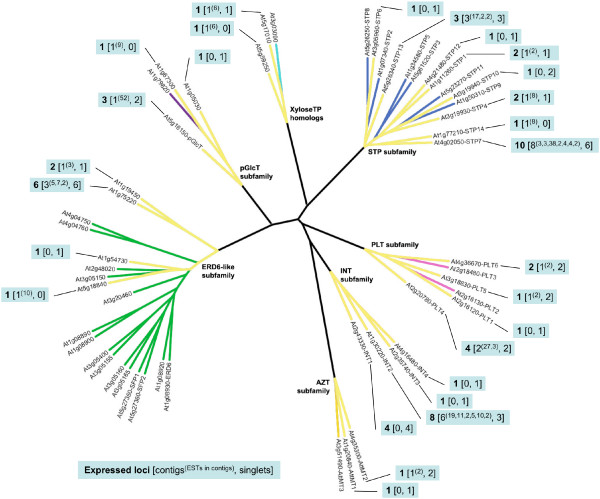
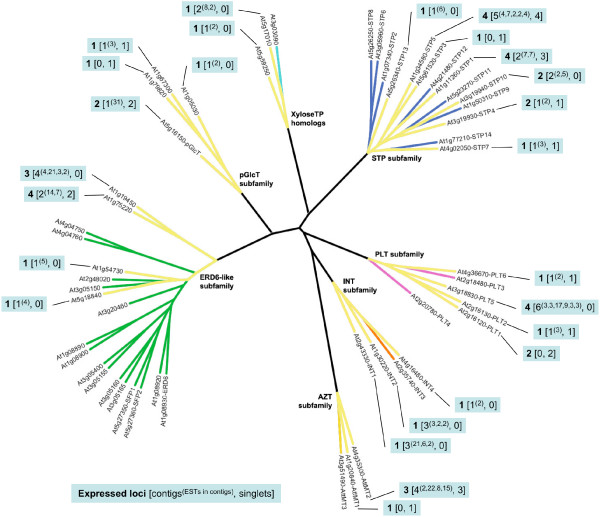
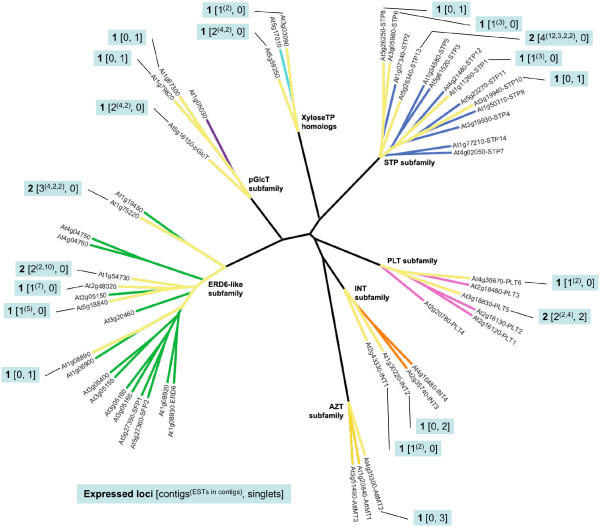
Background: In plants, tandem, segmental and whole-genome duplications are prevalent, resulting in large numbers of duplicate loci. Recent studies suggest that duplicate genes diverge predominantly through the partitioning of expression and that breadth of gene expression is related to the rate of gene duplication and protein sequence evolution.Here, we utilize expressed sequence tag (EST) data to study gene duplication and expression patterns in the monosaccharide transporter (MST) gene family across the land plants. In Arabidopsis, there are 53 MST genes that form seven distinct subfamilies. We created profile hidden Markov models of each subfamily and searched EST databases representing diverse land plant lineages to address the following questions: 1) Are homologs of each Arabidopsis subfamily present in the earliest land plants? 2) Do expression patterns among subfamilies and individual genes within subfamilies differ across lineages? 3) Has gene duplication within each lineage resulted in lineage-specific expansion patterns? We also looked for correlations between relative EST database representation in Arabidopsis and similarity to orthologs in early lineages.
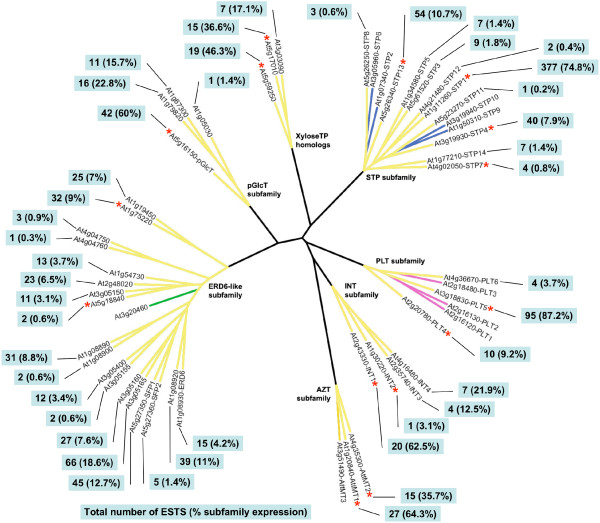
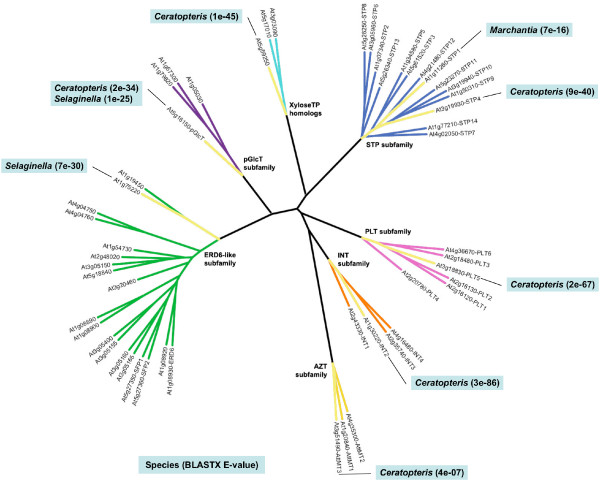
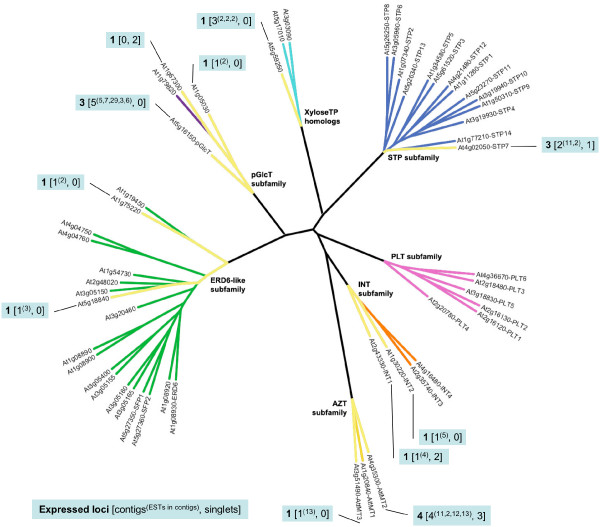
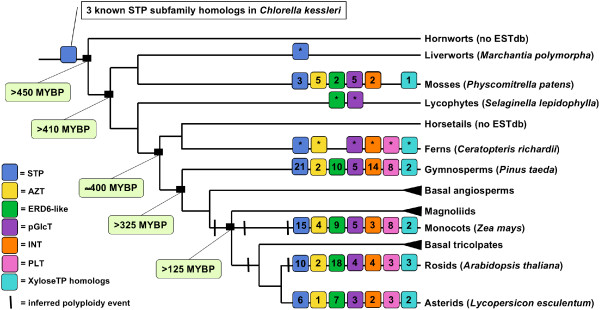
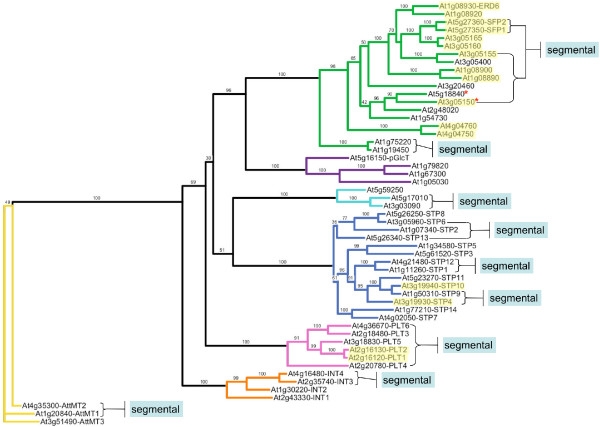
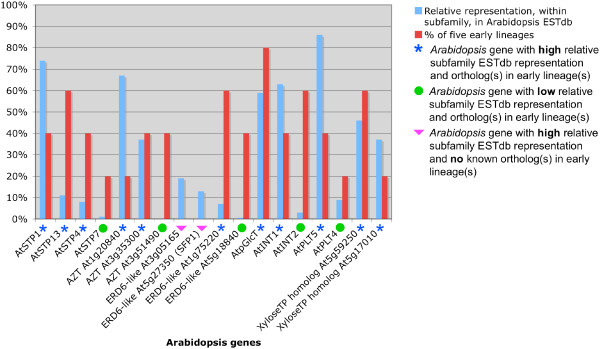
Results: Homologs of all seven MST subfamilies were present in land plants at least 400 million years ago. Subfamily expression levels vary across lineages with greater relative expression of the STP, ERD6-like, INT and PLT subfamilies in the vascular plants. In the large EST databases of the moss, gymnosperm, monocot and eudicot lineages, EST contig construction reveals that MST subfamilies have experienced lineage-specific expansions. Large subfamily expansions appear to be due to multiple gene duplications arising from single ancestral genes. In Arabidopsis, one or a few genes within most subfamilies have much higher EST database representation than others. Most highly represented (broadly expressed) genes in Arabidopsis have best match orthologs in early divergent lineages.
Conclusion: The seven subfamilies of the Arabidopsis MST gene family are ancient in land plants and show differential subfamily expression and lineage-specific subfamily expansions. Patterns of gene expression in Arabidopsis and correlation of highly represented genes with best match homologs in early lineages suggests that broadly expressed genes are often highly conserved, and that most genes have more limited expression.
Figures
Similar articles
-
The monosaccharide transporter gene family in Arabidopsis and rice: a history of duplications, adaptive evolution, and functional divergence.Mol Biol Evol. 2007 Nov;24(11):2412-23. doi: 10.1093/molbev/msm184. Epub 2007 Sep 6. Mol Biol Evol. 2007. PMID: 17827171
-
Genome-wide identification and investigation of monosaccharide transporter gene family based on their evolution and expression analysis under abiotic stress and hormone treatments in maize (Zea mays L.).BMC Plant Biol. 2024 Jun 4;24(1):496. doi: 10.1186/s12870-024-05186-2. BMC Plant Biol. 2024. PMID: 38831278 Free PMC article.
-
Evolution of RLSB, a nuclear-encoded S1 domain RNA binding protein associated with post-transcriptional regulation of plastid-encoded rbcL mRNA in vascular plants.BMC Evol Biol. 2016 Jun 29;16(1):141. doi: 10.1186/s12862-016-0713-1. BMC Evol Biol. 2016. PMID: 27356975 Free PMC article.
-
Genome histories clarify evolution of the expansin superfamily: new insights from the poplar genome and pine ESTs.J Plant Res. 2006 Jan;119(1):11-21. doi: 10.1007/s10265-005-0253-z. Epub 2006 Jan 13. J Plant Res. 2006. PMID: 16411016 Review.
-
Current topics in genome evolution: molecular mechanisms of new gene formation.Cell Mol Life Sci. 2007 Mar;64(5):542-54. doi: 10.1007/s00018-006-6453-4. Cell Mol Life Sci. 2007. PMID: 17192808 Free PMC article. Review.
Cited by
-
A Novel Insight into Functional Divergence of the MST Gene Family in Rice Based on Comprehensive Expression Patterns.Genes (Basel). 2019 Mar 20;10(3):239. doi: 10.3390/genes10030239. Genes (Basel). 2019. PMID: 30897847 Free PMC article.
-
Micro-Evolution Analysis Reveals Diverged Patterns of Polyol Transporters in Seven Gramineae Crops.Front Genet. 2020 Jun 19;11:565. doi: 10.3389/fgene.2020.00565. eCollection 2020. Front Genet. 2020. PMID: 32636871 Free PMC article.
-
Involvement of abscisic acid in the coordinated regulation of a stress-inducible hexose transporter (VvHT5) and a cell wall invertase in grapevine in response to biotrophic fungal infection.Plant Physiol. 2010 May;153(1):211-21. doi: 10.1104/pp.110.154765. Epub 2010 Mar 26. Plant Physiol. 2010. PMID: 20348211 Free PMC article.
-
Leaf gene expression trajectories during the growing season are consistent between sites and years in American beech.Proc Biol Sci. 2024 Apr 10;291(2020):20232338. doi: 10.1098/rspb.2023.2338. Epub 2024 Apr 10. Proc Biol Sci. 2024. PMID: 38593851 Free PMC article.
-
Genome-wide analysis of sugar transporter genes in maize (Zea mays L.): identification, characterization and their expression profiles during kernel development.PeerJ. 2023 Nov 17;11:e16423. doi: 10.7717/peerj.16423. eCollection 2023. PeerJ. 2023. PMID: 38025667 Free PMC article.
References
-
- Taylor JS, Raes J. Duplication and divergence: The evolution of new genes and old ideas. Annu Rev Genet. 2004;38:615–643. - PubMed
-
- Ohno S. Evolution by Gene Duplication. Springer-Verlag; 1970. p. 160.
-
- Ohta T. Further simulation studies on the evolution by gene duplication. Evolution. 1988;42:375–386. - PubMed
-
- Moore RC, Purugganan MD. The evolutionary dynamics of plant duplicate genes. Curr Opin Plant Biol. 2005;8:122–128. - PubMed
Publication types
MeSH terms
Substances
Grants and funding
LinkOut - more resources
Full Text Sources
Other Literature Sources
Molecular Biology Databases
Research Materials
