. 2006 Aug 25;126(4):789-99.
doi: 10.1016/j.cell.2006.06.049.

Anatomical profiling of nuclear receptor expression reveals a hierarchical transcriptional network

Affiliations

Anatomical profiling of nuclear receptor expression reveals a hierarchical transcriptional network

Angie L Bookout et al. Cell. .

Abstract

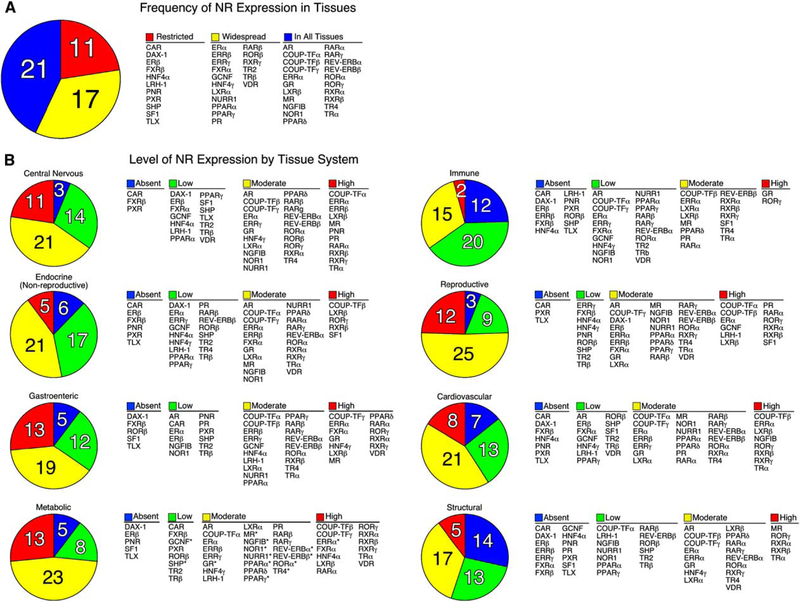
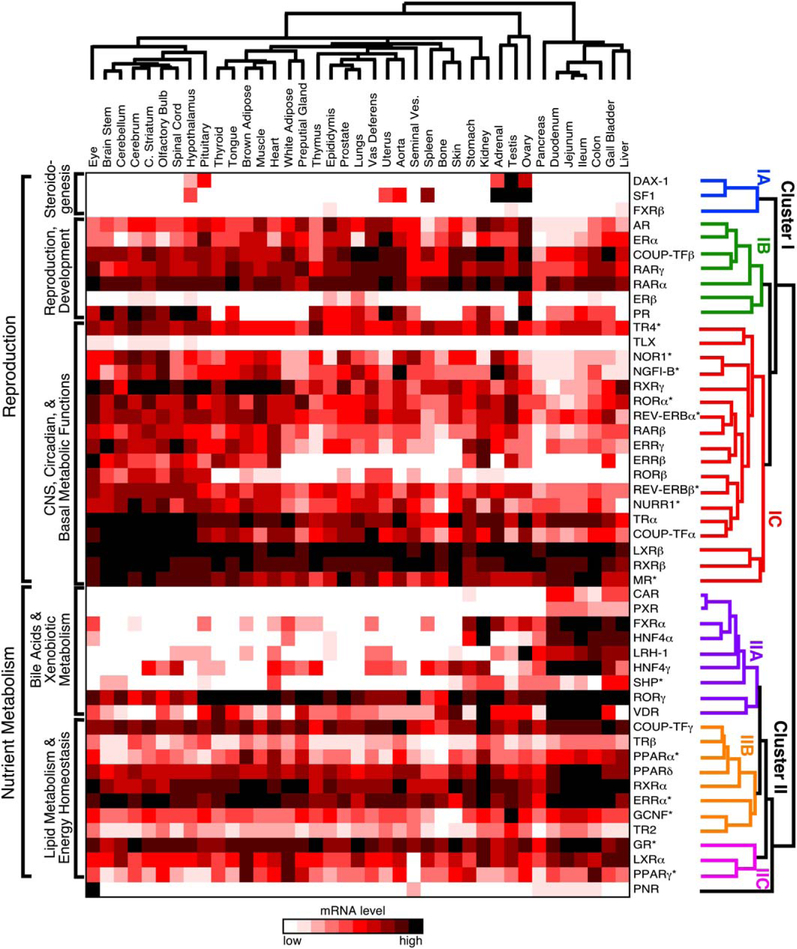
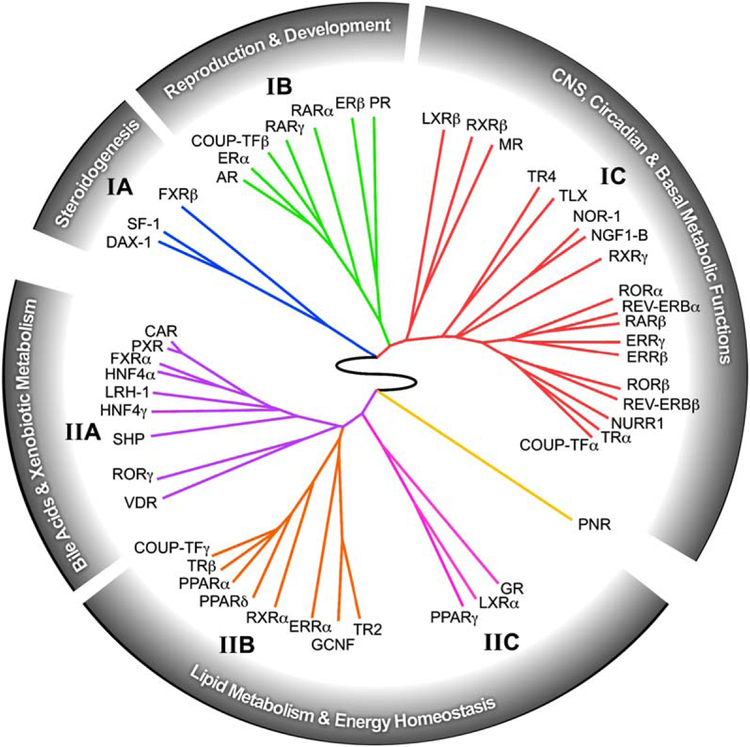
In multicellular organisms, the ability to regulate reproduction, development, and nutrient utilization coincided with the evolution of nuclear receptors (NRs), transcription factors that utilize lipophilic ligands to mediate their function. Studying the expression profile of NRs offers a simple, powerful way to obtain highly relational information about their physiologic functions as individual proteins and as a superfamily. We surveyed the expression of all 49 mouse NR mRNAs in 39 tissues, representing diverse anatomical systems. The resulting data set uncovers several NR clades whose patterns of expression indicate their ability to coordinate the transcriptional programs necessary to affect distinct physiologic pathways. Remarkably, this regulatory network divides along the following two physiologic paradigms: (1) reproduction, development, and growth and (2) nutrient uptake, metabolism, and excretion. These data reveal a hierarchical transcriptional circuitry that extends beyond individual tissues to form a meganetwork governing physiology on an organismal scale.


Figures

Figure 1.
Figure 1.. Distribution of C57/BL6 Mouse Nuclear Receptor mRNA
(A) The number of NRs expressed in various tissues is indicated in the pie chart and their names are shown in the table on the right. NRs were grouped into three categories based on their tissue distribution: Restricted (expressed in less than 50% of tissues), Widespread (expressed in more than 50% but not all tissues), and In All Tissues (expressed in 100% of tissues). (B) The levels of NR expression in different tissue systems are indicated by the pie charts and their names are shown in the tables to the right. Normalized NR mRNA-expression levels were defined as Absent if the Ct value was ≥34, Low if the level was below 0.1 arbitrary units, Moderate if the level was between 0.1 and 1, and High if the level was >1.0 arbitrary units. Tissues systems were categorized as follows: central nervous system (eye, brainstem, cerebellum, cerebrum, corpus striatum, olfactory bulb, spinal cord, hypothalamus, and pituitary); nonreproductive endocrine system (adrenal, thyroid, and pancreas); gastroenteric system (tongue, stomach, duodenum, jejunum, ileum, colon, and gall bladder); metabolic system (liver, kidney, brown and white adipose, and muscle); immune system (spleen and thymus); reproductive system (ovary, uterus, epididymus, preputial gland, prostate, seminal vesicles, testis, and vas deferens); cardiovascular system (aorta, heart, and lungs); and structural system (bone and skin). Note that tissues were pooled from male mice (n = 6) except for ovary and uterus. An asterisk (*) indicates NRs that have a strong circadian expression and were lowest at time of analysis (see accompanying manuscript by Yang et al., 2006 in this issue of Cell).
Figure 2.
Figure 2.. Unsupervised Hierarchical Clustering of Nuclear Receptors Relative to Tissue Expression Pattern
The mRNA tissue-distribution profile of the NR superfamily in the C57/BL6 mouse was evaluated by unsupervised hierarchical clustering using Matrix 1.28 software as described in Experimental Procedures. Individual NRs segregate into two main clusters (labeled I and II) and six subclusters (labeled IA, IB, IC, IIA, IIB, and IIC) that define higher-order functional relationships. The dendrogram of NR clusters is color-coded for clarity. The asterisk (*) indicates NRs that have a strong circadian expression and were lowest at time of analysis.
Figure 3.
Figure 3.. Tissue-Selective Expression of Nuclear Receptors Defines a Common Set of Regulatory Queues
Expression of NRs that are restricted to specific tissue systems implies the existence of common transcriptional mechanisms to regulate their expression. Examples are shown for NRs expressed in the C57/Bl6 mouse gastroenteric system (A), central nervous system (B), and steroidogenic tissues (C). An asterisk (*) indicates NRs that have a strong circadian expression and were lowest at time of analysis. Representatives of duplicate experiments are shown. Values are plotted as the mean of triplicate measurements ± standard deviation error bars.
Figure 4.
Figure 4.. The Nuclear Receptor Ring of Physiology
The relationship between receptor expression, function, and physiology is depicted as a circular dendrogram using the hierarchical, unsupervised clustering of NR tissue expression distribution profiles obtained from Figure 2. The analysis reveals the existence of a higher-order network tying nuclear receptor function to reproduction, development, central, and basal metabolic functions, dietary-lipid metabolism, and energy homeostasis.

References

    1. Akhmedov NB, Piriev NI, Chang B, Rapoport AL, Hawes NL, Nishina PM, Nusinowitz S, Heckenlively JR, Roderick TH, Kozak CA, et al. (2000). A deletion in a photoreceptor-specific nuclear receptor mRNA causes retinal degeneration in the rd7 mouse. Proc. Natl. Acad. Sci. USA 97, 5551–5556. - PMC - PubMed
    1. Barish GD, Downes M, Alaynick WA, Yu RT, Ocampo CB, Bookout AL, Mangelsdorf DJ, and Evans RM (2005). A Nuclear Receptor Atlas: macrophage activation. Mol. Endocrinol 19, 2466–2477. - PubMed
    1. Beland M, and Lohnes D (2005). Chicken ovalbumin upstream promoter-transcription factor members repress retinoic acid-induced Cdx1 expression. J. Biol. Chem 280, 13858–13862. - PubMed
    1. Beuschlein F, Keegan CE, Bavers DL, Mutch C, Hutz JE, Shah S, Ulrich-Lai YM, Engeland WC, Jeffs B, Jameson JL, and Hammer GD (2002). SF-1, DAX-1, and acd: molecular determinants of adrenocortical growth and steroidogenesis. Endocr. Res 28, 597–607. - PubMed
    1. Bookout AL, and Mangelsdorf DJ (2003). Quantitative real-time PCR protocol for analysis of nuclear receptor signaling pathways. Nucl. Recept. Signal 1, e012 10.1621/nrs.01012. - DOI - PMC - PubMed

Publication types

Substances