. 2006 Nov;26(21):8042-51.
doi: 10.1128/MCB.00722-06. Epub 2006 Aug 21.

Life with a single isoform of Akt: mice lacking Akt2 and Akt3 are viable but display impaired glucose homeostasis and growth deficiencies

Affiliations

Life with a single isoform of Akt: mice lacking Akt2 and Akt3 are viable but display impaired glucose homeostasis and growth deficiencies

Bettina Dummler et al. Mol Cell Biol. 2006 Nov.

Abstract

To address the issues of isoform redundancy and isoform specificity of the Akt family of protein kinases in vivo, we generated mice deficient in both Akt2 and Akt3. In these mice, only the Akt1 isoform remains to perform essential Akt functions, such as glucose homeostasis, proliferation, differentiation, and early development. Surprisingly, we found that Akt2(-/-) Akt3(-/-) and even Akt1(+/-) Akt2(-/-) Akt3(-/-) mice developed normally and survived with minimal dysfunctions, despite a dramatic reduction of total Akt levels in all tissues. A single functional allele of Akt1 appears to be sufficient for successful embryonic development and postnatal survival. This is in sharp contrast to the previously described lethal phenotypes of Akt1(-/-) Akt2(-/-) mice and Akt1(-/-) Akt3(-/-) mice. However, Akt2(-/-) Akt3(-/-) mice were glucose and insulin intolerant and exhibited an approximately 25% reduction in body weight compared to wild-type mice. In addition, we found substantial reductions in relative size and weight of the brain and testis in Akt2(-/-) Akt3(-/-) mice, demonstrating an in vivo role for both Akt2 and Akt3 in the determination of whole animal size and individual organ sizes.


Figures
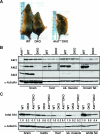
FIG. 1.
FIG. 1.
(A) Top view of wild-type (WT), Akt2−/− Akt3−/− (DKO), and Akt1+/− Akt2−/− Akt3−/− (Akt1+/−DKO) mice (12-week-old male mice; the WT and DKO mice were from the same litter). Note that the pictures are illustrative of the viability of mutant mice rather than a size comparison. (B) Akt1 protein levels in 4-day-old wild-type (WT) and Akt2−/− Akt3−/− (DKO) pups. The indicated tissues from wild-type and DKO pups were lysed and blotted with antibodies specific for Akt1, Akt2, and Akt3. As a loading control, the expression of α-tubulin was detected on the same membrane. Duplicates are from independent samples. (C) Stepwise reduction of total Akt levels in wild-type (WT), Akt2−/− Akt3−/− (DKO), and Akt+/− Akt2−/− Akt3−/− (Akt+/−DKO) mice. Tissues from 3-month-old mice of the indicated genotypes were lysed and blotted with an Akt antibody that recognizes all three isoforms. As a loading control, the expression of α-tubulin was detected on the same membrane. Bands were quantified, and indicated values represent total Akt expression relative to wild-type expression levels, normalized to the α-tubulin control. The experiment was performed twice with independent samples and with similar results.
FIG. 2.
FIG. 2.
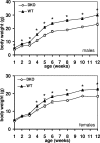
Growth deficiency in Akt2−/− Akt3−/− (DKO) mice. Body weights of male (upper panel) and female (lower panel) wild-type (filled triangles) and Akt2−/− Akt3−/− (open diamonds) littermate mice were determined at the indicated time points. The graph depicts arithmetic means ± SEM (n = 8 for each group). Significantly different values for Akt2−/− Akt3−/− mice versus the wild type, as determined by one-way ANOVA, are indicated (*, P < 0.05).
FIG. 3.
FIG. 3.
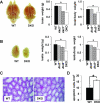
Selective reduction of brain and testis size in Akt2−/− Akt3−/− mice. (A) Brains were dissected from 3-month-old male wild-type (WT) and Akt2−/− Akt3−/− (DKO) littermate mice (left). Mean absolute brain weights (middle) and brain weights relative to body weight (right) of 3-month-old male mice of the indicated genotypes are shown (n = 8; *, P < 0.001). (B) Testes were dissected from 3-month-old wild-type and Akt2−/− Akt3−/− littermate mice (left). Mean absolute testis weights (middle) and testis weights relative to body weight (right) of 3-month-old mice of the indicated genotypes are depicted (n = 14; *, P < 0.001). Relative weights are percentages relative to the wild type (WT = 1). Error bars represent SEM. (C) Morphology of testes from wild-type and Akt2−/− Akt3−/− littermate mice. Representative sections stained with hematoxylin and eosin show morphologically normal seminiferous tubules. (D) Spontaneous apoptosis in testes of Akt2−/− Akt3−/− mice. The graph shows a comparison of TUNEL-positive cell numbers in testis sections from Akt2−/− Akt3−/− mice and their wild-type littermates (n = 3; *, P < 0.05).
FIG. 4.
FIG. 4.
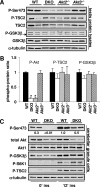
Phospho-Western blot analysis of downstream targets of Akt. (A) Representative blot showing steady-state phosphorylation of downstream targets of Akt in testes of wild-type (WT), Akt2−/−, Akt3−/−, and Akt2−/− Akt3−/− (DKO) littermate mice. (B) Quantification of phosphorylated Akt and downstream targets. Values are the means for three mice per genotype, error bars depict SEM, and phospho-protein/total protein ratios are relative to the wild-type ratio. Phospho-Akt values were normalized to α-tubulin. (C) Primary cerebellar granule cell cultures of wild-type (WT) and Akt2−/− Akt3−/− (DKO) mice were serum starved overnight and then stimulated with 100 nM insulin for 12 min. Lysates were analyzed for the phosphorylation status of the indicated downstream targets of Akt. Phospho-Akt bands (P-Ser473) were quantified, and indicated values represent the means for two mice per genotype. Values are relative to stimulated phospho-Akt levels in the wild type and were normalized to the α-tubulin control.
FIG. 5.
FIG. 5.
Glucose metabolism in Akt2−/− Akt3−/− mice. (A) A glucose tolerance test was performed on 12-week-old male (upper panel) and female (lower panel) mice of the indicated genotypes. The graph depicts arithmetic means ± SEM (n = 8 to 12 for each group) of plasma glucose concentrations following per os glucose administration (2 g/kg body weight). (B) An insulin tolerance test was performed on 15-week-old male (upper panel) and female (lower panel) mice of the indicated genotypes. The graph depicts arithmetic means ± SEM (n = 8 to 10 each group) of plasma glucose concentrations following intraperitoneal injection of insulin (1 mU/g body weight). All genotypes were littermate offspring of Akt2+/− Akt3+/− matings. Significantly different values obtained for Akt2−/− Akt3−/− mice (DKO) versus wild-type mice (WT), as determined by one-way ANOVA, are indicated (formula image, P < 0.05). In all four graphs, differences in Akt2−/− Akt3−/− versus Akt2−/− mice were not significant. (C) Active Akt and GSK3β in insulin-responsive tissues of wild-type and Akt2−/− Akt3−/− mice after in vivo insulin stimulation. Three-month-old male mice were made to fast overnight and injected with either saline (−) or insulin (10 mU/g body weight). After 12 min, the indicated tissues were harvested. Lysates were immunoblotted with the indicated antibodies. Samples are from individual mice (n = 3 for saline controls; n = 4 for insulin stimulation).

References

    1. Bae, S. S., H. Cho, J. Mu, and M. J. Birnbaum. 2003. Isoform-specific regulation of insulin-dependent glucose uptake by Akt/protein kinase B. J. Biol. Chem. 278:49530-49536. - PubMed
    1. Baker, J., J. P. Liu, E. J. Robertson, and A. Efstratiadis. 1993. Role of insulin-like growth factors in embryonic and postnatal growth. Cell 75:73-82. - PubMed
    1. Brazil, D. P., Z. Z. Yang, and B. A. Hemmings. 2004. Advances in protein kinase B signalling: AKTion on multiple fronts. Trends Biochem. Sci. 29:233-242. - PubMed
    1. Chang, P. Y., Y. Le Marchand-Brustel, L. A. Cheatham, and D. E. Moller. 1995. Insulin stimulation of mitogen-activated protein kinase, p90rsk, and p70 S6 kinase in skeletal muscle of normal and insulin-resistant mice. Implications for the regulation of glycogen synthase. J. Biol. Chem. 270:29928-29935. - PubMed
    1. Cheatham, B., C. J. Vlahos, L. Cheatham, L. Wang, J. Blenis, and C. R. Kahn. 1994. Phosphatidylinositol 3-kinase activation is required for insulin stimulation of pp70 S6 kinase, DNA synthesis, and glucose transporter translocation. Mol. Cell. Biol. 14:4902-4911. - PMC - PubMed

Publication types

MeSH terms

LinkOut - more resources