. 2006 Nov;26(21):7929-41.
doi: 10.1128/MCB.00617-06. Epub 2006 Aug 21.

Role of topoisomerase IIbeta in the expression of developmentally regulated genes

Affiliations

Role of topoisomerase IIbeta in the expression of developmentally regulated genes

Yi Lisa Lyu et al. Mol Cell Biol. 2006 Nov.

Abstract

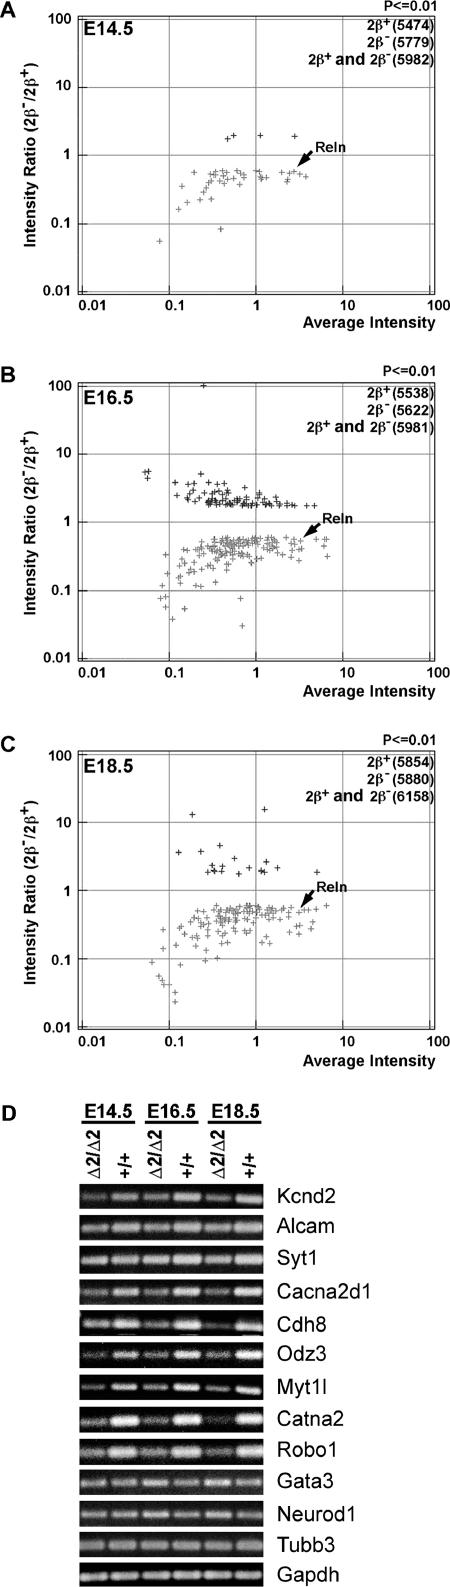
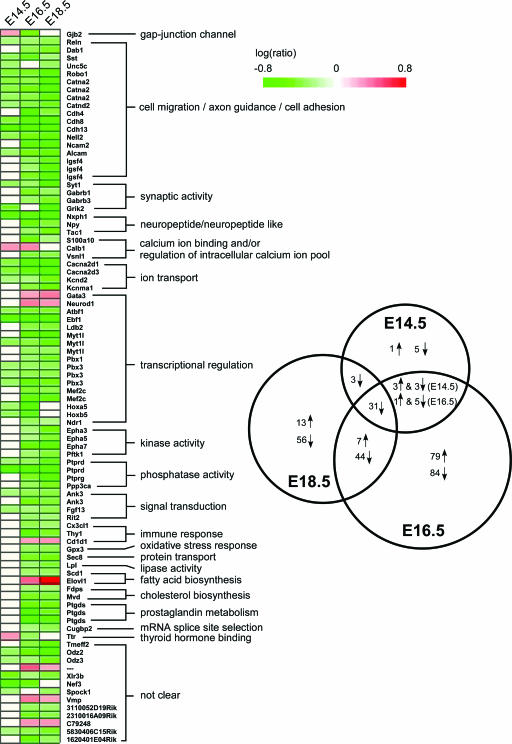
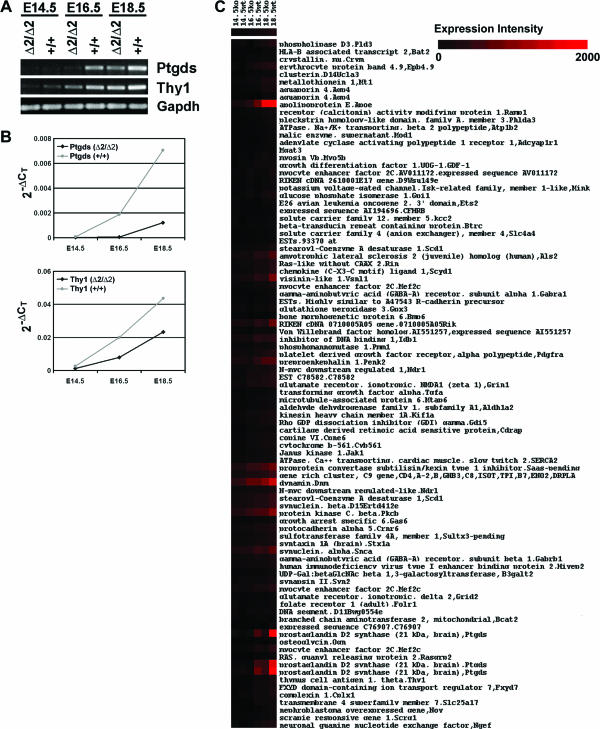
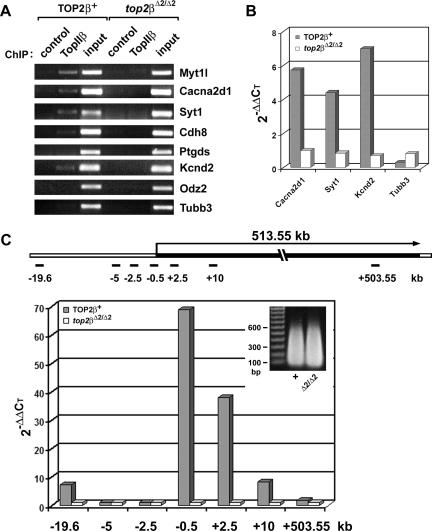
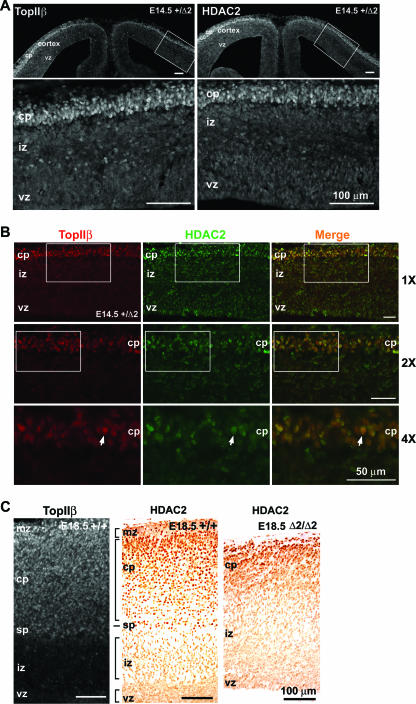
Mice lacking topoisomerase IIbeta (TopIIbeta) are known to exhibit a perinatal death phenotype. In the current study, transcription profiles of the brains of wild-type and top2beta knockout mouse embryos were generated. Surprisingly, only a small number (1 to 4%) of genes were affected in top2beta knockout embryos. However, the expression of nearly 30% of developmentally regulated genes was either up- or down-regulated. By contrast, the expression of genes encoding general cell growth functions and early differentiation markers was not affected, suggesting that TopIIbeta is not required for early differentiation programming but is specifically required for the expression of developmentally regulated genes at later stages of differentiation. Consistent with this notion, immunohistochemical analysis of brain sections showed that TopIIbeta and histone deacetylase 2, a known TopIIbeta-interacting protein, were preferentially expressed in neurons which are in their later stages of differentiation. Chromatin immunoprecipitation analysis of the developing brains revealed TopIIbeta binding to the 5' region of a number of TopIIbeta-sensitive genes. Further studies of a TopIIbeta-sensitive gene, Kcnd2, revealed the presence of TopIIbeta in the transcription unit with major binding near the promoter region. Together, these results support a role of TopIIbeta in activation/repression of developmentally regulated genes at late stages of neuronal differentiation.


Figures

FIG. 1.
FIG. 1.
Transcription profiling of the brain of a top2βΔ1/Δ1 mutant embryo by using cDNA microarrays. Total RNAs isolated from the brains of E15.5 top2βΔ1/Δ1 knockout and wild-type embryos were used to generate labeled first-strand cDNAs (Cy3 for the wild-type and Cy2 for mutant brains) and hybridized to Incyte cDNA microarrays GEM1 (upper panel) and GEM2 (lower panel). Hybridization intensities of different probes were analyzed using the Rosetta Resolver application. Intensity differences with P values of ≤0.05 were considered differentially expressed and plotted. The log10(intensityko/intensitywt) value (y axis; intensity ratio [2β/2β+]) was plotted against the log10[(intensityko + intensitywt)/2] value (x axis; average intensity) for each cDNA probe. Examples of differentially expressed genes that are involved in neuronal functions are indicated by arrows.
FIG. 2.
FIG. 2.
Differential gene expression in the brains of top2βΔ2/Δ2 embryos at different developmental stages. (A to C) Transcription profiling of the brains of top2βΔ2/Δ2 mutant embryos using Affymetrix oligo microarrays. The log10(intensityko/intensitywt) value (y axis; intensity ratio [2β/2β+]) was plotted against the log10[(intensityko + intensitywt)/2] value (x axis; average intensity) for each probe set. Probe sets with intensity ratios of ≥1.7-fold (either the intensityko/intensitywt or intensitywt/intensityko ratio) and P values of ≤0.01 were included in the plot. The numbers of probe sets that are expressed in the brains of wild-type (2β+) and top2βΔ2/Δ2 mutant (2β) embryos as well as the combined unique probe sets (2β+ and 2β) at each developmental stage are indicated in the upper right hand corner of each plot. (D) RT-PCR analysis of genes that are differentially expressed in the mutant. First-strand cDNAs were reverse transcribed from the total RNAs isolated from top2βΔ2/Δ2 (Δ2/Δ2) mutant and wild-type (+/+) embryos. PCR was then performed using a primer set specific to each gene as indicated to the right. PCR products were analyzed by agarose gel electrophoresis.
FIG. 3.
FIG. 3.
Genes involved in various biological pathways are affected in the brains of top2βΔ2/Δ2 mutant embryos. Shown to the right is the Venn diagram representation of the number of overlapping differentially expressed genes in the brains of top2βΔ2/Δ2 embryos between or among different developmental stages (E14.5, E16.5, and E18.5). ↑, up-regulation; ↓, down-regulation. Shown to the left is a heat map representation of genes showing differential expression at any two (or all three) developmental stages. These genes were grouped together according to their involvement in a particular biological pathway. Each column represents individual developmental stages (E14.5, E16.5, and E18.5). Log(ratio), log10(intensityko/intensitywt); green bar, down-regulation [log(ratio) < 0]; red bar, up-regulation [log(ratio) > 0]; white, no change [log(ratio) = 0].
FIG. 4.
FIG. 4.
Developmentally regulated genes are preferentially affected in the brains of top2βΔ2/Δ2 embryos. (A) Comparison of developmentally regulated genes during normal mouse brain development (E14.5 to E16.5 [2β+]) and differentially expressed genes in the brains of mutant embryos (E16.5 [2β versus 2β+]). The developmentally regulated genes (E14.5 to E16.5 [2β+]) are defined as those that are differentially expressed in the brain of the wild-type E16.5 embryo compared to that of the E14.5 embryo. The log10(intensityE16.5/intensityE14.5) value (y axis; intensity ratio [E16.5/E14.5]) was plotted against the log10[(intensityE14.5 + intensityE16.5)/2] value (x axis; average intensity) for each probe set. The total number of probe sets that are differentially expressed during this period of development is 314 (intensity ratios ≥ 1.7 [either the intensity E16.5/intensityE14.5 or intensityE14.5/intensityE16.5 ratio] and P ≤ 0.01). The differentially expressed probe sets in the brain of the E16.5 top2βΔ2/Δ2 mutant embryo are shown to the right (also see similar plot shown in Fig. 2B). (B) Venn diagram representation of the number of overlapping genes between developmentally regulated genes (E14.5 to E16.5 [2β+]) and differentially expressed genes (E16.5 [2β versus 2β+]).
FIG. 5.
FIG. 5.
RT-PCR and clustering analysis of developmentally regulated genes in the brains of top2βΔ2/Δ2 embryos. (A) RT-PCR analysis of Ptgds and Thy1 in the brains of top2βΔ2/Δ2 mutant embryos. First-strand cDNAs were synthesized using total RNAs isolated from wild-type (+/+) and top2βΔ2/Δ2 (Δ2/Δ2) mutant embryos. PCR was then performed using primer pairs specific to Ptgds and Thy1 cDNAs. PCR products were analyzed by agarose gel electrophoresis. (B) Real-time RT-PCR analysis. First-strand cDNAs were used to perform real-time PCR with primer pairs specific to Ptgds, Thy1, and Gapdh cDNAs. The value of the threshold cycle (CT) for each PCR was determined. The ΔCT value of Ptgds or Thy1 of wild-type (+/+) or top2β mutant (Δ2/Δ2) embryos at a particular developmental stage is defined as the difference between the CT value of Ptgds (or Thy1) and that of the corresponding Gapdh [CT (Ptgds or Thy1) − CT (Gapdh)]. The 2−ΔCT values for Ptgds (upper panel) and Thy1 (lower panel) were then plotted against each developmental stage (E14.5, E16.5, and E18.5). (C) Heat map plot of hierarchical clustering of absolute expression intensities. Clustering analysis was performed, and a cluster of genes that showed a similar pattern of expression as that of Ptgds and Thy1 is presented. ko, top2βΔ2/Δ2; wt, Top2β+/+.
FIG. 6.
FIG. 6.
ChIP analysis of TopIIβ binding to TopIIβ-sensitive genes. (A) ChIP analysis using PCR. ChIP analysis using anti-TopIIβ antibody was performed on sheared chromatin (<4 kb) isolated from E18.5 brains of both TOP2β+ (two Top2β+/+ and three top2β+/Δ2 brains combined) and null mutant (top2βΔ2/Δ2) embryos. The ChIP products were PCR amplified using primer sets corresponding to the promoter regions of various genes (Myt1l, Cacna2d1, Syt1, Cdh8, Ptgds, Kcnd2, Odz2, and Tubb3) as described in Materials and Methods. For control samples, no antibody was added during ChIP. (B) ChIP analysis using quantitative real-time PCR. Quantitative real-time PCR was performed on the same ChIP products (described for panel A) using the same primer sets corresponding to the promoter regions of Cacna2d1, Syt1, Kcnd2, and Tubb3. Data were analyzed using the SDS 2.2 software. The threshold cycle value for each sample was chosen from the linear range. The relative amount of DNA in the ChIP product was calculated with the use of the 2−ΔΔCT method (32), using “input” as the normalization standard for each sample and the “control” as the baseline. (C) TopIIβ binding to the transcription unit of the Kcnd2 gene. Quantitative real-time PCR was performed on ChIP products as described for panel B, except that the ChIP was performed on sheared chromatin with an average size of 300 bp (insert) and the primer sets covering different regions of the Kcnd2 gene (see the schematic representation of the 513.55-kb transcription unit of the Kcnd2 gene) were used.
FIG. 7.
FIG. 7.
Elevated expression of TopIIβ and HDAC2 in more-mature neurons of the cerebral cortex. (A) Coronal sections (20-μm cryosections) of the E14.5 top2β+/Δ2 telencephalon immunostained with antibodies against IIβ (left panel) and HDAC2 (right panel). The lower panels represent the magnified views of the boxed areas in the corresponding upper panels. (B) Coronal sections (16-μm cryosections) of the E14.5 top2β+/Δ2 medial lateral telencephalon immunostained with antibodies against IIβ (red) and HDAC2 (green). The 2× magnification images of the boxed areas of the top panels (labeled 1X) are shown in the middle panels, and 2× magnification images (labeled 4X) of the boxed areas of the middle panels are shown in the bottom panels. A representative neuron with colocalized IIβ (red) and HDAC2 (green) is indicated by an arrow. The relative magnifications (×1, ×2, and ×4) are shown on the right of the panels. (C) E18.5 sagittal sections of the Top2β+/+ neocortex stained with anti-IIβ (20-μm cryosection) and anti-HDAC2 (6-μm paraffin section) antibodies, as well as the E18.5 sagittal section of the top2βΔ2/Δ2 neocortex stained with anti-HDAC2 antibody (6-μm paraffin section). Bars, 100 μm (A and C) and 50 μm (B). vz, ventricular zone; iz, intermediate zone; sp, subplate; cp, cortical plate; mz, marginal zone.

References

    1. Allen, M. P., M. Xu, C. Zeng, S. A. Tobet, and M. E. Wierman. 2000. Myocyte enhancer factors-2B and -2C are required for adhesion related kinase repression of neuronal gonadotropin releasing hormone gene expression. J. Biol. Chem. 275:39662-39670. - PubMed
    1. Austin, C. A., and K. L. Marsh. 1998. Eukaryotic DNA topoisomerase II beta. Bioessays 20:215-226. - PubMed
    1. Austin, C. A., J. H. Sng, S. Patel, and L. M. Fisher. 1993. Novel HeLa topoisomerase II is the II beta isoform: complete coding sequence and homology with other type II topoisomerases. Biochim. Biophys. Acta 1172:283-291. - PubMed
    1. Bhat, M. A., A. V. Philp, D. M. Glover, and H. J. Bellen. 1996. Chromatid segregation at anaphase requires the barren product, a novel chromosome-associated protein that interacts with topoisomerase II. Cell 87:1103-1114. - PubMed
    1. Boulikas, T. 1995. Chromatin domains and prediction of MAR sequences. Int. Rev. Cytol. 162A:279-388. - PubMed

Publication types

MeSH terms

Substances