

Spontaneous and evoked synaptic rewiring in the neonatal neocortex
- PMID: 16924105
- PMCID: PMC1559779
- DOI: 10.1073/pnas.0604691103
Spontaneous and evoked synaptic rewiring in the neonatal neocortex
Abstract
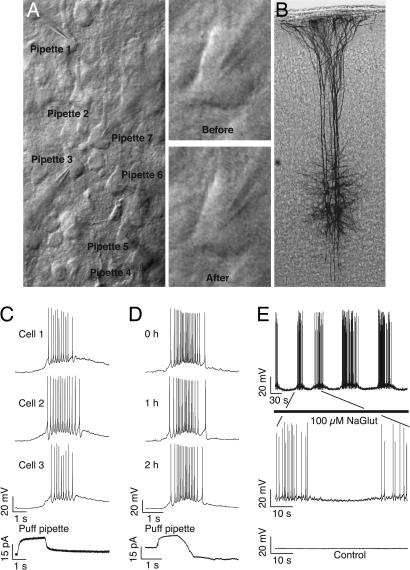
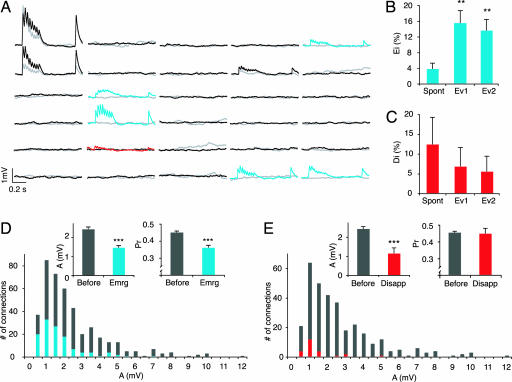
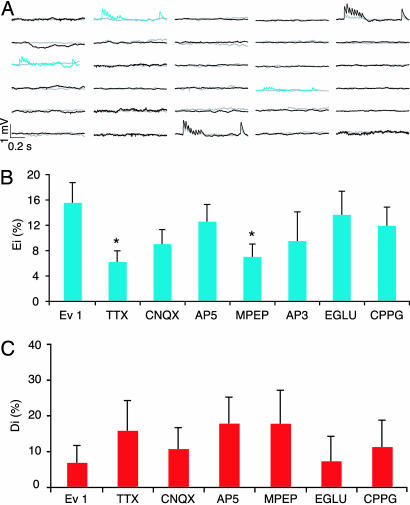
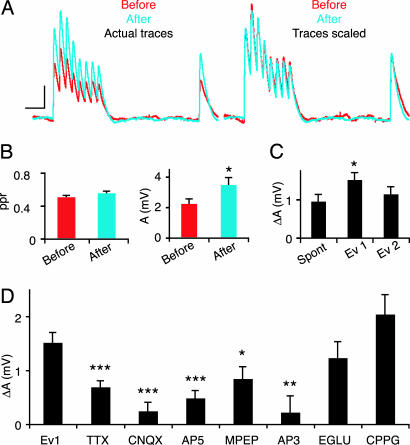
The local microcircuitry of the neocortex is structurally a tabula rasa, with the axon of each pyramidal neuron having numerous submicrometer appositions with the dendrites of all neighboring pyramidal neurons, but is functionally highly selective, with synapses formed onto only a small proportion of these targets. This design leaves a vast potential for the microcircuit to rewire without extensive axonal or dendritic growth. To examine whether rewiring does take place, we used multineuron patch-clamp recordings on 12- to 14-day-old rat neocortical slices and studied long-term changes in synaptic connectivity within clusters of neurons. We found pyramidal neurons spontaneously connecting and disconnecting from each other and that exciting the slice with glutamate greatly increases the number of new connections established. Evoked emergence of new synaptic connections requires action potential activity and activation of metabotropic glutamate receptor 5, but not NMDA receptor or group II or group III metabotropic glutamate receptor activation. We also found that it is the weaker connections that are selectively eliminated. These results provide direct evidence for spontaneous and evoked rewiring of the neocortical microcircuitry involving entire functional multisynaptic connections. We speculate that this form of microcircuit plasticity enables an evolution of the microcircuit connectivity by natural selection as a function of experience.
Conflict of interest statement
Conflict of interest statement: No conflicts declared.
Figures
Similar articles
-
The neocortical microcircuit as a tabula rasa.Proc Natl Acad Sci U S A. 2005 Jan 18;102(3):880-5. doi: 10.1073/pnas.0407088102. Epub 2005 Jan 3. Proc Natl Acad Sci U S A. 2005. PMID: 15630093 Free PMC article.
-
Distinct Ca2+ channels mediate transmitter release at excitatory synapses displaying different dynamic properties in rat neocortex.Cereb Cortex. 2006 Mar;16(3):386-93. doi: 10.1093/cercor/bhi117. Epub 2005 May 25. Cereb Cortex. 2006. PMID: 15917483
-
Functional expression of nicotinic acetylcholine receptors in rat neocortical layer 5 pyramidal cells.Cereb Cortex. 2009 May;19(5):1079-91. doi: 10.1093/cercor/bhn158. Epub 2008 Sep 15. Cereb Cortex. 2009. PMID: 18794204
-
Spinal dorsal horn synaptic plasticity: involvement of group I metabotropic glutamate receptors.Prog Brain Res. 2000;129:115-34. doi: 10.1016/S0079-6123(00)29009-2. Prog Brain Res. 2000. PMID: 11098685 Review. No abstract available.
-
Dendritic release of retrograde messengers controls synaptic transmission in local neocortical networks.Neuroscientist. 2005 Aug;11(4):334-44. doi: 10.1177/1073858405275827. Neuroscientist. 2005. PMID: 16061520 Review.
Cited by
-
Approximate invariance of metabolic energy per synapse during development in mammalian brains.PLoS One. 2012;7(3):e33425. doi: 10.1371/journal.pone.0033425. Epub 2012 Mar 27. PLoS One. 2012. PMID: 22479396 Free PMC article.
-
What is memory? The present state of the engram.BMC Biol. 2016 May 19;14:40. doi: 10.1186/s12915-016-0261-6. BMC Biol. 2016. PMID: 27197636 Free PMC article.
-
Slow-Wave Activity in the S1HL Cortex Is Contributed by Different Layer-Specific Field Potential Sources during Development.J Neurosci. 2019 Nov 6;39(45):8900-8915. doi: 10.1523/JNEUROSCI.1212-19.2019. Epub 2019 Sep 23. J Neurosci. 2019. PMID: 31548234 Free PMC article.
-
Hebbian crosstalk prevents nonlinear unsupervised learning.Front Comput Neurosci. 2009 Sep 24;3:11. doi: 10.3389/neuro.10.011.2009. eCollection 2009. Front Comput Neurosci. 2009. PMID: 19826612 Free PMC article.
-
The spine neck filters membrane potentials.Proc Natl Acad Sci U S A. 2006 Nov 21;103(47):17961-6. doi: 10.1073/pnas.0608755103. Epub 2006 Nov 8. Proc Natl Acad Sci U S A. 2006. PMID: 17093040 Free PMC article.
References
MeSH terms
Substances
LinkOut - more resources
Full Text Sources
Other Literature Sources
Miscellaneous
