. 2006 Aug 29;103(35):13040-4.
doi: 10.1073/pnas.0603101103. Epub 2006 Aug 21.

Precise adaptation in bacterial chemotaxis through "assistance neighborhoods"

Affiliations

Precise adaptation in bacterial chemotaxis through "assistance neighborhoods"

Robert G Endres et al. Proc Natl Acad Sci U S A. .

Abstract

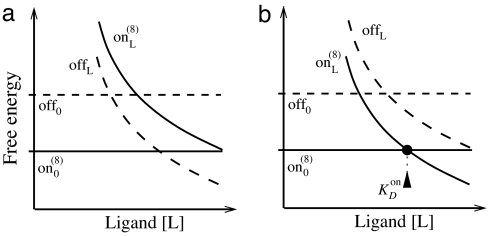
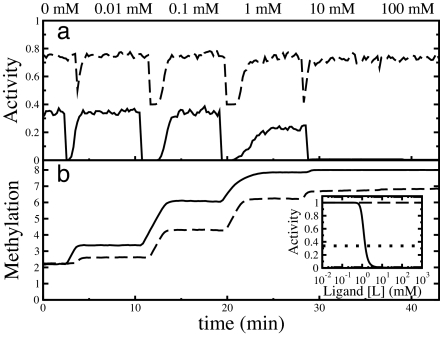
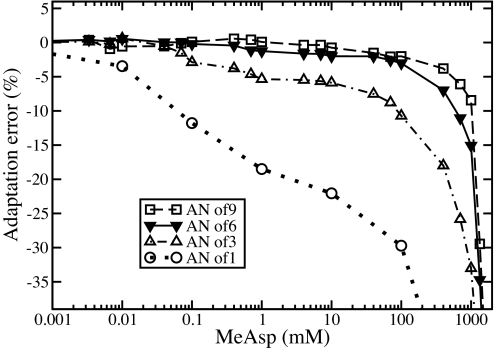
The chemotaxis network in Escherichia coli is remarkable for its sensitivity to small relative changes in the concentrations of multiple chemical signals over a broad range of ambient concentrations. Key to this sensitivity is an adaptation system that relies on methylation and demethylation (or deamidation) of specific modification sites of the chemoreceptors by the enzymes CheR and CheB, respectively. It was recently discovered that these enzymes can access five to seven receptors when tethered to a particular receptor. We show that these "assistance neighborhoods" are necessary for precise adaptation in a model for signaling by clusters of chemoreceptors. In agreement with experiment, model clusters composed of receptors of different types exhibit high sensitivity and precise adaptation over a wide range of chemical concentrations and the response of adapted clusters to addition/removal of attractant scales with free-energy change. We predict two limits of precise adaptation at large attractant concentrations: Either receptors reach full methylation and turn off, or receptors become saturated and cease to respond to attractant but retain their adapted activity.


Conflict of interest statement

Conflict of interest statement: No conflicts declared.

Figures

Fig. 1.
Fig. 1.
Representative energy-level diagram for a single receptor as a function of attractant (ligand) concentration. Shown are the free energies of the on states (solid lines) with and without bound ligand, onL and on0, and similarly for the off states (dashed lines). For clarity, only the free energies of the fully demethylated (0) and fully methylated (8) on states are shown. By convention, the free energies of the off states do not depend on receptor methylation.
Fig. 2.
Fig. 2.
Theoretical response of receptor activity to addition/removal of attractant (Attr) and repellent (Rep) for mixed clusters of adapting (WT) receptors (a) and nonadapting half-methylated or amidated receptors (b) (4Q4E). Attr: 100 μM MeAsp for WT and 50 μM MeAsp at 50 μM ambient MeAsp for 4Q4E. Rep: 100 μM NiCl2 for WT and 4Q4E. (a Inset) Schematic cluster of receptors with tethered CheR (green) and CheB (red) acting on assistance neighborhoods (within dashed lines). Receptor colors are as follows: high-abundance Tsr (light blue) and Tar (dark blue). (b Inset) Same simulation as a but without employing assistance neighborhoods.
Fig. 3.
Fig. 3.
Theoretical response of WT, adapting receptors to steps of MeAsp at different ambient concentrations. (a) Activity immediately after step change in concentration of MeAsp after complete adaptation to ambient concentrations 0 (circle), 0.1 (square), 0.5 (diamond), and 5 (triangle) mM. Additional MeAsp was added (filled symbols) and then removed after adaptation (open symbols) in a sequence of steps of increasing size. (b) Dependence of the response sensitivity, defined as (ΔA/A)/(Δ[L]/[L]), where A is activity, on increases in the concentration of MeAsp of 10% (filled circles) and 50% (open circles), as a function of the ambient concentration. (b Inset) Activity immediately after step change in concentration of serine after complete adaptation to ambient concentrations of MeAsp: 0 (filled circle), 10 mM (filled diamond), and 100 mM (filled triangle). Curves in a and b are to guide the eye. (c) Data from a plotted as a function of the absolute value of free energy change upon addition/removal of attractant. (c Inset) Same data for small free-energy changes plotted on a linear scale; slopes are ±0.2/kBT. Curves in c are calculated by using the free energy model (see supporting information).
Fig. 4.
Fig. 4.
Two peaks of receptor response to MeAsp. (a) Theoretical receptor response ΔA/(Δ[L]/[L]) for mixed clusters of receptors as a function of ambient MeAsp concentration ([L]) for Δ[L]/[L] = 10%. Curves show responses of adapted (WT) and nonadapting (xQyE, where x and y are the number of glutamines/methyl groups and glutamates, respectively) receptors. Plotted are averages over 100 independent simulations for clusters of 18 receptors, 6 Tar, and 12 Tsr. (b and c) Analytical results for single mixed cluster. (b) Methylation independent dF/dlog([MeAsp]); also shown are the MeAsp dissociation constants for Tar (a) and Tsr (s) receptors. (c) dA/dF; WT is assumed to adapt for all MeAsp concentrations. Key applies to a and c.
Fig. 5.
Fig. 5.
The two limits of adaptation, illustrated for a single receptor. (a) Receptor turns off at large attractant concentration if the off state with ligand becomes the lowest free-energy state. (b) Receptor retains adapted activity but ceases to respond to ligand if the fully methylated on state with ligand becomes the lowest free-energy state. The curve labels are the same as in Fig. 1. The arrow indicates KDon, i.e., the concentration at which a receptor in the on state is occupied by attractant 50% of the time.
Fig. 6.
Fig. 6.
Adaptation of a homogeneous cluster of 18 receptors for different values of Koff: 0.018 (solid line) and 0.06 (dashed line) mM. The remaining parameters correspond to Tar and MeAsp values. (a) Response of receptor activity to progressive step increases in attractant concentration (0–100 mM). Solid curve is raised vertically by 0.4. (b) Corresponding average receptor methylation levels. (Inset) Activity as a function of attractant concentration for fully methylated receptors. The steady-state activity of adapted receptors is indicated by the dotted line.
Fig. 7.
Fig. 7.
Adaptation error [A([MeAsp]) − A(0)]/A(0), where A is the time-averaged receptor activity, for increasing assistance neighborhood (AN) sizes of 1, 3, 6, and 9 receptors, for a mixed cluster of 6 Tar and 12 Tsr receptors. Each AN has the same Tsr:Tar ratio of 2:1, except when the AN size is 1.

References

    1. Berg H. C., Brown D. A. Nature. 1972;239:500–504. - PubMed
    1. Bray D., Levin M. D., Morton-Firth C. J. Nature. 1998;393:85–88. - PubMed
    1. Duke T. A., Bray D. Proc. Natl. Acad. Sci. USA. 1999;96:10104–10108. - PMC - PubMed
    1. Barkai N., Leibler S. Nature. 1997;387:913–917. - PubMed
    1. Li M, Hazelbauer G. L. Mol. Microbiol. 2005;56:1617–1626. - PubMed

Publication types

LinkOut - more resources