. 2006:2:43.
doi: 10.1038/msb4100084. Epub 2006 Aug 22.

A quantitative study of the benefits of co-regulation using the spoIIA operon as an example

Affiliations

A quantitative study of the benefits of co-regulation using the spoIIA operon as an example

Dagmar Iber. Mol Syst Biol. 2006.

Abstract

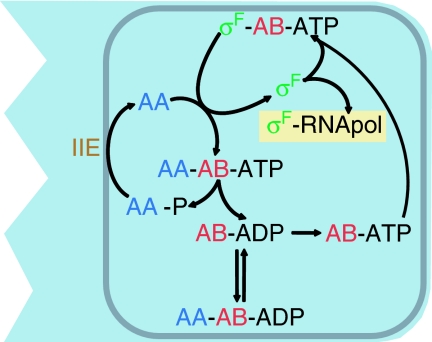
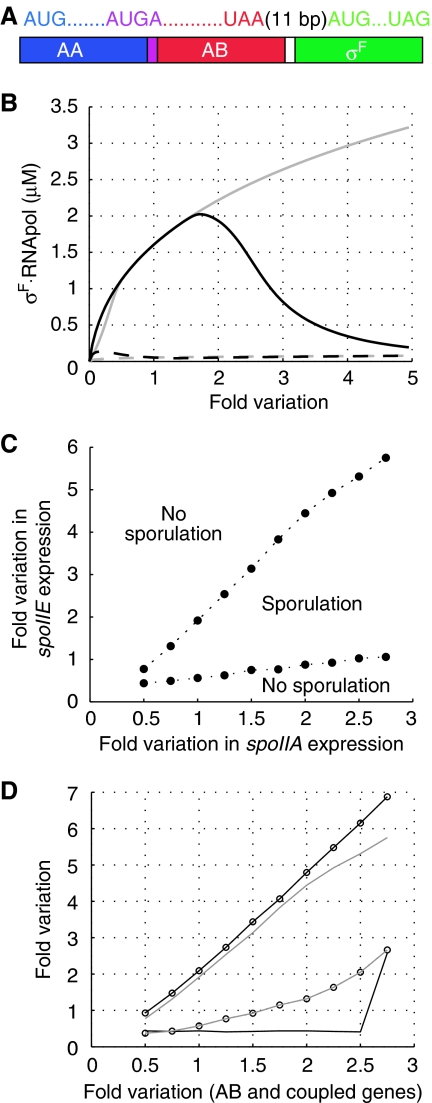
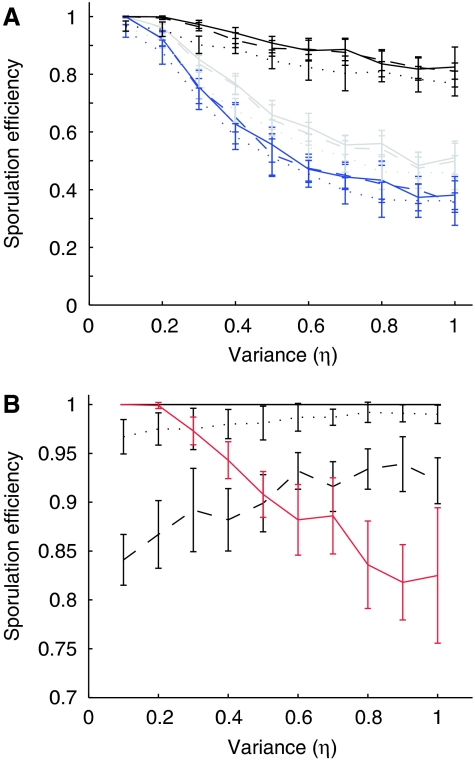
The distribution of most genes is not random, and functionally linked genes are often found in clusters. Several theories have been put forward to explain the emergence and persistence of operons in bacteria. Careful analysis of genomic data favours the co-regulation model, where gene organization into operons is driven by the benefits of coordinated gene expression and regulation. Direct evidence that coexpression increases the individual's fitness enough to ensure operon formation and maintenance is, however, still lacking. Here, a previously described quantitative model of the network that controls the transcription factor sigma(F) during sporulation in Bacillus subtilis is employed to quantify the benefits arising from both organization of the sporulation genes into the spoIIA operon and from translational coupling. The analysis shows that operon organization, together with translational coupling, is important because of the inherent stochastic nature of gene expression, which skews the ratios between protein concentrations in the absence of co-regulation. The predicted impact of different forms of gene regulation on fitness and survival agrees quantitatively with published sporulation efficiencies.


Figures

Figure 1
Figure 1
An overview of the interactions in the network that controls σF activity in B. subtilis. For details, see text. The figure is a reproduction of Figure 1 of Iber et al (2006).
Figure 2
Figure 2
The impact of parallel and random variations in the expression of spoIIE and spoIIA genes on σF release. (A) The spoIIA operon comprises the genes for SpoIIAA, SpoIIAB, and σF. The genes for SpoIIAA and SpoIIAB overlap; the genes for SpoIIAB and σF are separated by 11 bp. (B) The regulatory network is robust to parallel variations in gene expression. The predicted concentration of σF-RNA polymerase holoenzyme before (dashed lines) and after septum formation (continuous lines) if either all (grey lines) or all protein expression rates except that of SpoIIE (black lines) were increased by the factor on the horizontal axis compared to the standard reference rates (6 × 10⁻⁹ M s−1 for SpoIIAA and SpoIIAB dimers and 2 × 10⁻⁹ M s−1 for σF and SpoIIE; Iber et al, 2006). (C, D) The expression rate combinations for which septation-dependent σF release is possible (between the lines) or not possible (outside the area marked by lines). (C) The impact of differential regulation of spoIIE and spoIIA expression. The vertical and horizontal axes indicate the fold variation in the spoIIE and spoIIA expression rates respectively, compared to the standard reference rates. (D) The impact of differential regulation of the expression of genes encoded in the spoIIA operon. The vertical axis indicates the fold variation in the expression of SpoIIAA (circles), σF (black lines), or SpoIIAA and σF (grey lines). The horizontal axis indicates the fold variation in the expression of SpoIIAB and of any other protein whose expression is coupled to that of SpoIIAB (which are those genes in the spoIIA operon not reported on the vertical axis). The sudden jump observed at a high SpoIIAB to σF ratio (lower black line) is the consequence of impaired σF release when the relative SpoIIAB concentration is too high.
Figure 3
Figure 3
The impact of stochastic variation in gene expression on sporulation efficiency. (A) The fraction of successful sporulation events (as defined in the text) dependent on the variance in gene expression if expression of the spoIIA genes is either coupled (black lines), the expression of SpoIIAB and σF is coupled (grey lines), or the expression of SpoIIAA and σF is coupled (blue lines). SpoIIE is expressed throughout at the standard rate of 2 × 10⁻⁹ M s−1. The broken lines show the effect of an additional independent normal variation in the rate of σF expression with ηS=0.1 (dashed lines) or ηS=0.3 (dotted lines) from the coupled rates. If σF is one of the coupled rates, then σF expression is varied both together with its coupling partner and additionally independently to reflect the additive levels of noise acting at the initiation of translation and the re-initiation/dissociation step. (B) The fraction of successful sporulation events (as defined in the text) dependent on the variance in gene expression if expression of the spoIIA and spoIIE genes is coupled (to assess the benefits of correlated expression), and an additional noise term ηE is added to the expression of spoIIE with ηE=0.1 (black continuous line), ηE=0.3 (dotted line), or ηE=0.6 (dashed line); ηE assesses the effects of independent promoters and spatial heterogeneity in the concentration of transcription and translation factors. The red line is identical to the continuous black line in panel A (noise in coupled spoIIA expression, SpoIIE expressed at 2 × 10⁻⁹ M s−1). Mean and standard deviation are based on 10 times 100 independent runs.

References

    1. Adhin MR, van Duin J (1990) Scanning model for translational reinitiation in eubacteria. J Mol Biol 213: 811–818 - PubMed
    1. Arigoni F, Pogliano K, Webb C, Stragier P, Losick R (1995) Localization of protein implicated in establishment of cell type to sites of asymmetric division. Science 270: 637–640 - PubMed
    1. Ben-Yehuda S, Losick R (2002) Asymmetric cell division in B. subtilis involves a spirallike intermediate of the cytokinetic protein FtsZ. Cell 109: 257–266 - PubMed
    1. Dandekar T, Snel B, Huynen M, Bork P (1998) Conservation of gene order: a fingerprint of proteins that physically interact. Trends Biochem Sci 23: 324–328 - PubMed
    1. Duncan L, Alper S, Arigoni F, Losick R, Stragier P (1995) Activation of cell-specific transcription by a serine phosphatase at the site of asymmetric division. Science 270: 641–644 - PubMed

Publication types

MeSH terms