

Selecting normalization genes for small diagnostic microarrays
- PMID: 16925821
- PMCID: PMC1560169
- DOI: 10.1186/1471-2105-7-388
Selecting normalization genes for small diagnostic microarrays
Abstract
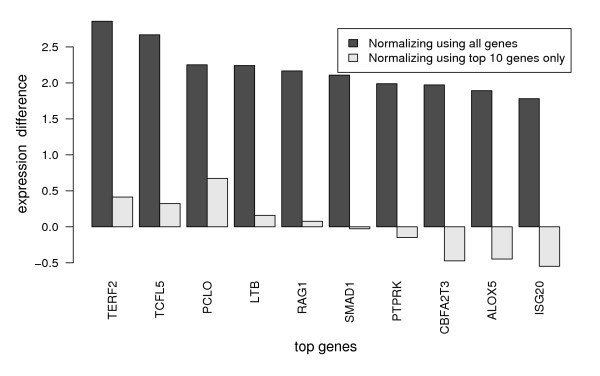
Background: Normalization of gene expression microarrays carrying thousands of genes is based on assumptions that do not hold for diagnostic microarrays carrying only few genes. Thus, applying standard microarray normalization strategies to diagnostic microarrays causes new normalization problems.
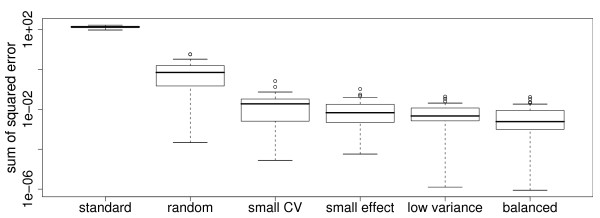
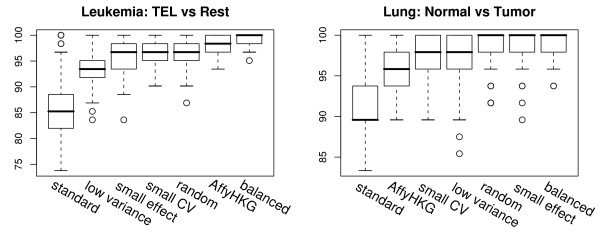
Results: In this paper we point out the differences of normalizing large microarrays and small diagnostic microarrays. We suggest to include additional normalization genes on the small diagnostic microarrays and propose two strategies for selecting them from genomewide microarray studies. The first is a data driven univariate selection of normalization genes. The second is multivariate and based on finding a balanced diagnostic signature. Finally, we compare both methods to standard normalization protocols known from large microarrays.
Conclusion: Not including additional genes for normalization on small microarrays leads to a loss of diagnostic information. Using house keeping genes from the literature for normalization fails to work for certain datasets. While a data driven selection of additional normalization genes works well, the best results were obtained using a balanced signature.
Figures
Similar articles
-
Selection and validation of normalization methods for c-DNA microarrays using within-array replications.Bioinformatics. 2007 Sep 15;23(18):2391-8. doi: 10.1093/bioinformatics/btm361. Epub 2007 Jul 27. Bioinformatics. 2007. PMID: 17660210
-
DNA microarrays for comparison of gene expression profiles between diagnosis and relapse in precursor-B acute lymphoblastic leukemia: choice of technique and purification influence the identification of potential diagnostic markers.Leukemia. 2003 Jul;17(7):1324-32. doi: 10.1038/sj.leu.2402974. Leukemia. 2003. PMID: 12835720
-
New normalization methods for cDNA microarray data.Bioinformatics. 2003 Jul 22;19(11):1325-32. doi: 10.1093/bioinformatics/btg146. Bioinformatics. 2003. PMID: 12874043
-
DNA microarrays in pediatric cancer.Cancer J. 2001 Jan-Feb;7(1):2-15. Cancer J. 2001. PMID: 11269644 Review.
-
Transcriptome data analysis for cell culture processes.Adv Biochem Eng Biotechnol. 2012;127:27-70. doi: 10.1007/10_2011_116. Adv Biochem Eng Biotechnol. 2012. PMID: 22194060 Review.
Cited by
-
Differential functional genomic effects of anti-inflammatory phytocompounds on immune signaling.BMC Genomics. 2010 Sep 24;11:513. doi: 10.1186/1471-2164-11-513. BMC Genomics. 2010. PMID: 20868472 Free PMC article.
-
Robust model selection for classification of microarrays.Cancer Inform. 2009 Jun 25;7:141-57. doi: 10.4137/cin.s2704. Cancer Inform. 2009. PMID: 19718450 Free PMC article.
-
Across-Experiment Transcriptomics of Sheep Rumen Identifies Expression of Lipid/Oxo-Acid Metabolism and Muscle Cell Junction Genes Associated With Variation in Methane-Related Phenotypes.Front Genet. 2018 Aug 20;9:330. doi: 10.3389/fgene.2018.00330. eCollection 2018. Front Genet. 2018. PMID: 30177952 Free PMC article.
-
Normalization of boutique two-color microarrays with a high proportion of differentially expressed probes.Genome Biol. 2007;8(1):R2. doi: 10.1186/gb-2007-8-1-r2. Genome Biol. 2007. PMID: 17204140 Free PMC article.
References
-
- van 't Veer L, Dai H, van de Vijver M, He Y, Hart A, Mao M, Peterse H, van der Kooy K, Marton M, Witteveen A, Schreiber G, Kerkhoven R, Roberts C, Linsley P, Bernards R, Friend S. Gene expression profiling predicts clinical outcome of breast cancer. Nature. 2002;415:530–6. doi: 10.1038/415530a. - DOI - PubMed
-
- Yeoh E, Ross M, Shurtleff S, Williams W, Patel D, Mahfouz R, Behm F, Raimondi S, Relling M, Patel A, Cheng C, Campana D, Wilkins D, Zhou X, Li J, Liu H, Pui C, Evans W, Naeve C, Wong L, Downing J. Classification, subtype discovery, and prediction of outcome in pediatric acute lymphoblastic leukemia by gene expression profiling. Cancer Cell. 2002;1:133–143. doi: 10.1016/S1535-6108(02)00032-6. - DOI - PubMed
-
- Lapointe J, Li C, Higgins JP, van de Rijn M, Bair E, Montgomery K, Ferrari M, Egevad L, Rayford W, Bergerheim U, Ekman P, DeMarzo AM, Tibshirani R, Botstein D, Brown PO, Brooks JD, Pollack JR. Gene expression profiling identifies clinically relevant subtypes of prostate cancer. Proc Natl Acad Sci USA. 2004;101:811–6. doi: 10.1073/pnas.0304146101. - DOI - PMC - PubMed
-
- Chang HY, Nuyten DS, Sneddon JB, Hastie T, Tibshirani R, Sørlie T, Dai H, He YD, Veer LJV, Bartelink H, van de Rijn M, Brown PO, van de Vijver MJ. Robustness, scalability, and integration of a wound-response gene expression signature in predicting breast cancer survival. Proc Natl Acad Sci USA. 2005;102:3738–43. doi: 10.1073/pnas.0409462102. - DOI - PMC - PubMed
-
- Li W, Yang Y. Methods of Microarray Data Analysis. Kluwer Academic; 2002. How many genes are needed for a discriminant microarray data analysis; pp. 137–150.
Publication types
MeSH terms
LinkOut - more resources
Full Text Sources
Other Literature Sources
Medical
